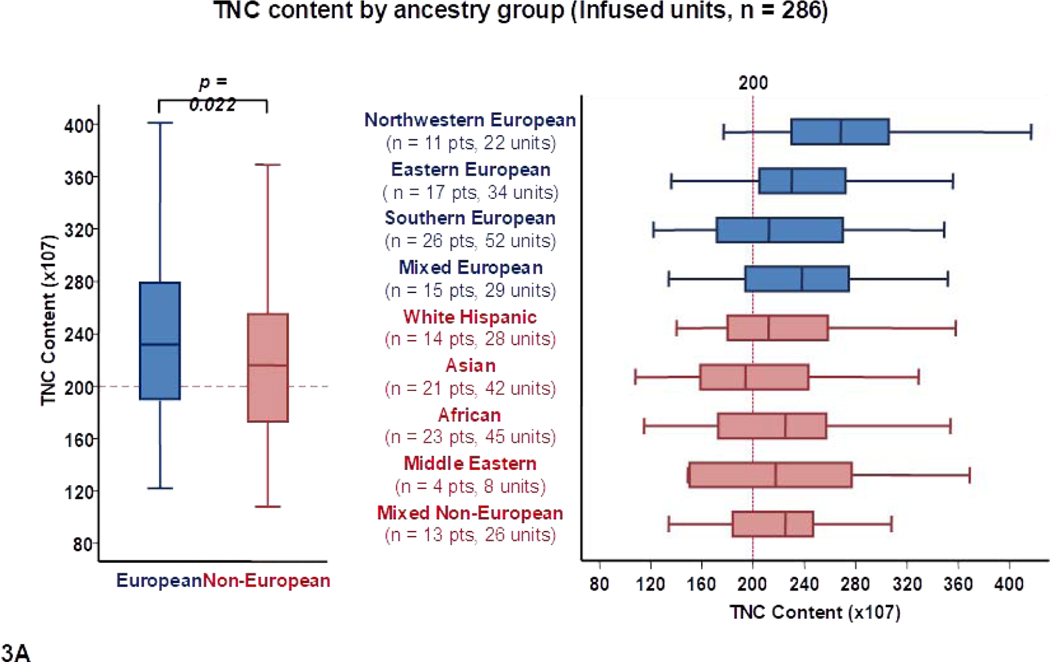
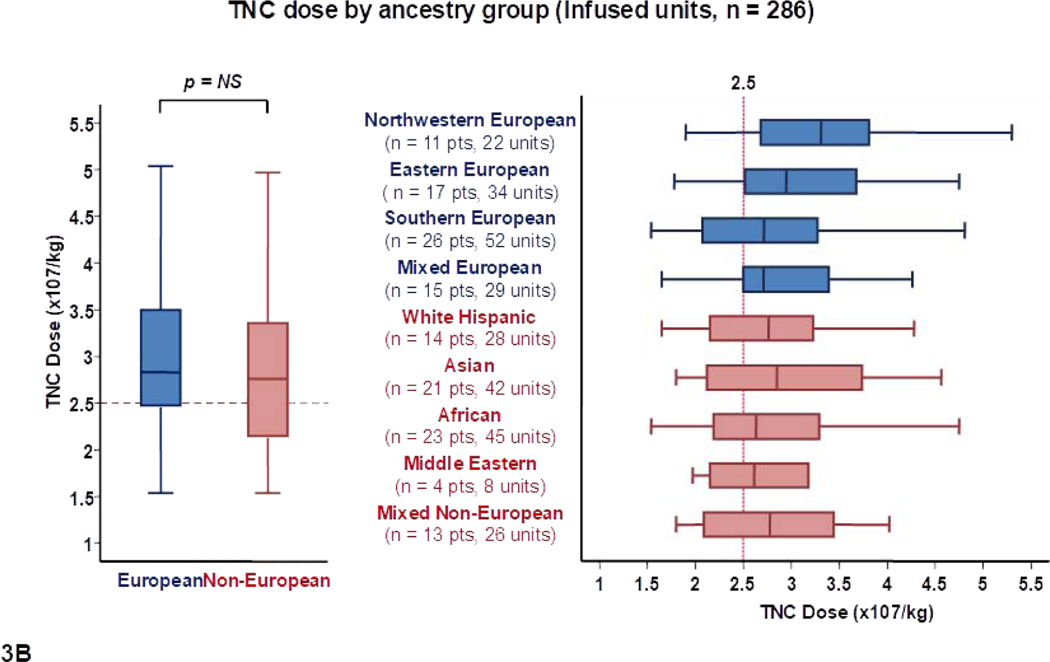
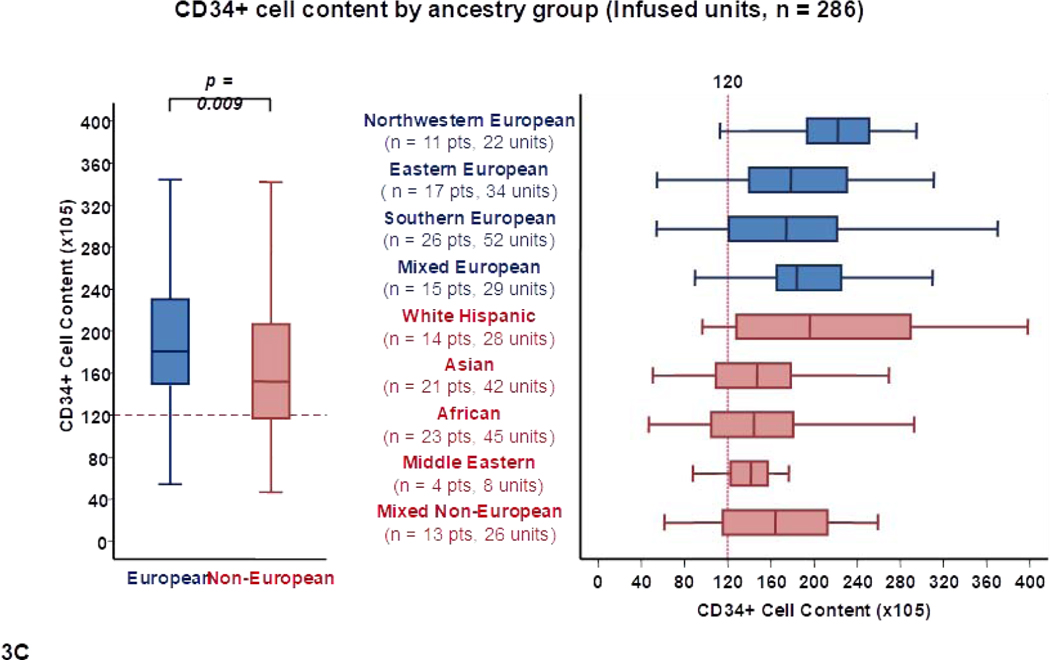
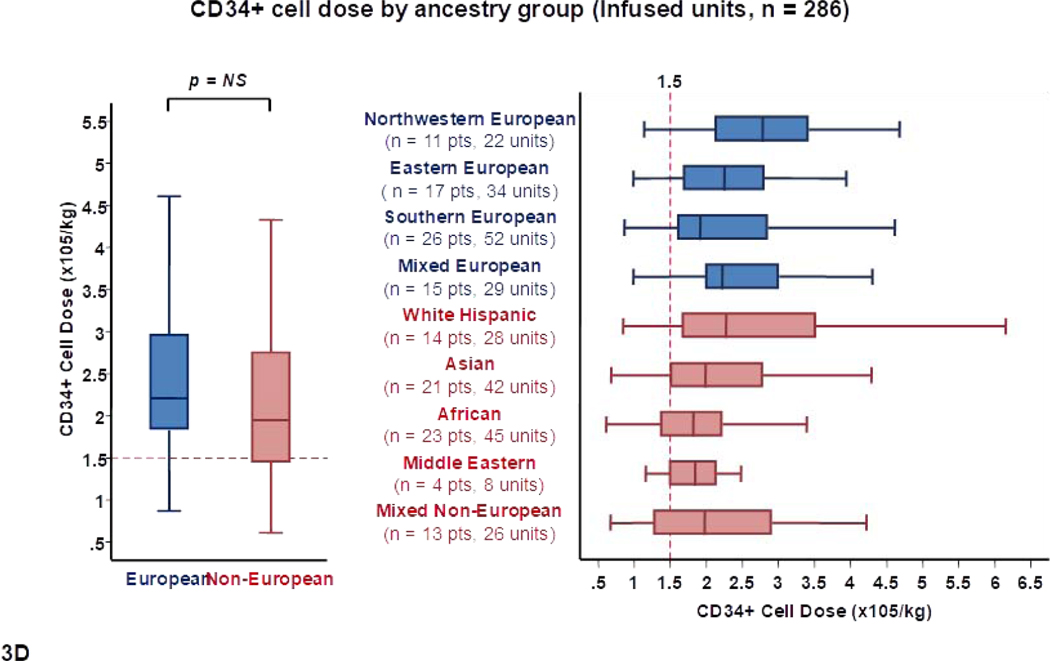
Figure 3.
Panel 3A shows TNC content, 3B shows TNC dose, 3C shows CD34+ cell content and 3D shows CD34+ dose of transplanted units (n = 286) by patient ancestry. The dotted reference lines in 3A and 3C denote the respective TNC content (200 × 107) and CD34+ cell content (120 × 105) that provide the minimum TNC and CD34+ cell dose for single unit CB grafts for an 80 Kg patient. The dotted reference lines in 3B and 3D denoted the minimum TNC (2.5 × 10⁷) and CD34+ cell (1.5 × 10⁵) dose criteria for single unit CB grafts.
Footnote: * 5 units in panel 3A (left), 9 in 3A (right), 9 in 3B (left), 10 in 3B (right), 15 in 3C (left), 17 in 3C (right), 14 in 3D (left) and 13 in 3D (right) were excluded as outliers (defined as units with cell content or dose 1.5 times outside the respective Interquartile Range).


