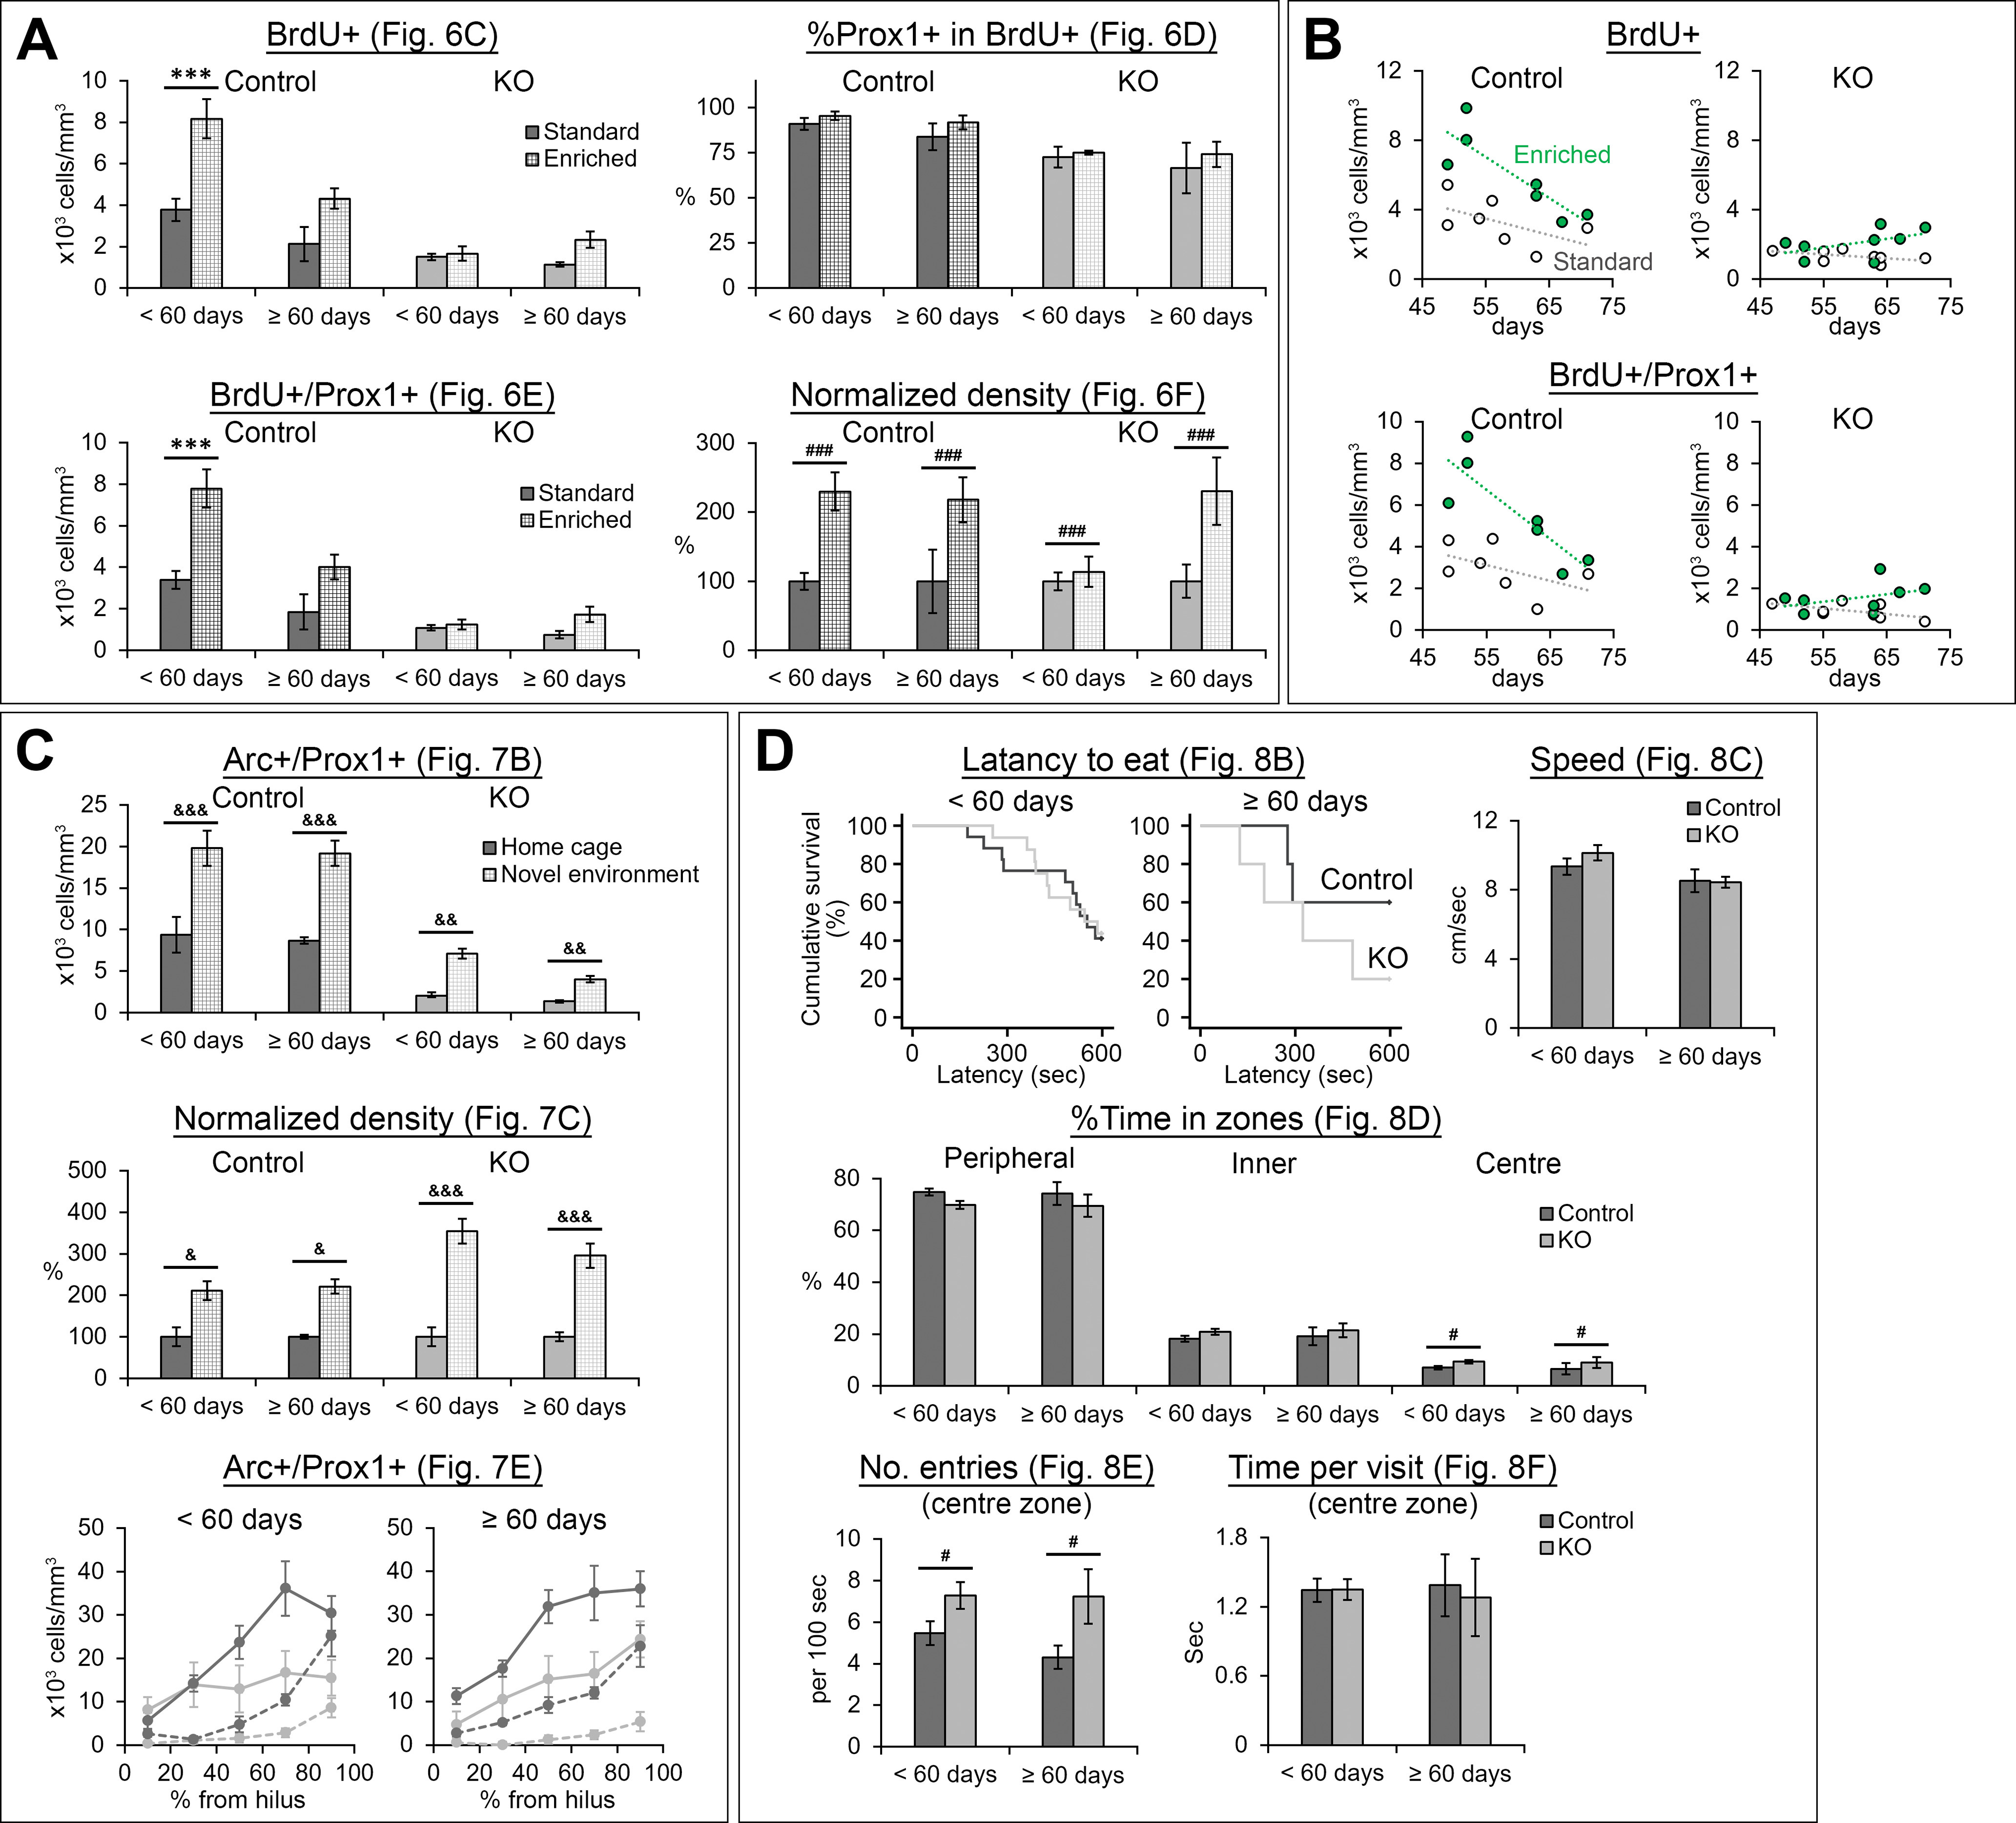
Figure 10.

Graphs showing data from <60- and ≥60-d-old mice separately. Data corresponding to Figures 6 (A), 7 (C), and 8 (D) are shown separately for <60- and ≥60-d-old mice. B, Relationship of the densities of BrdU+ and BrdU+/Prox1+ cells with the age of mice at the time of the first BrdU injection. Statistical results are summarized in Table 15-Table 26; ***p < 0.005, Tukey’s HSD test, performed because of significant genotype × housing interaction in two-way ANOVA; #p < 0.05, ###p < 0.005, the main effect of genotype, &p < 0.05, &&p < 0.01, &&&p < 0.005, Tukey’s HSD test (home cage vs novel environment including both age groups together and performed separately for each genotype; performed because of significant genotype × exposure interaction).
