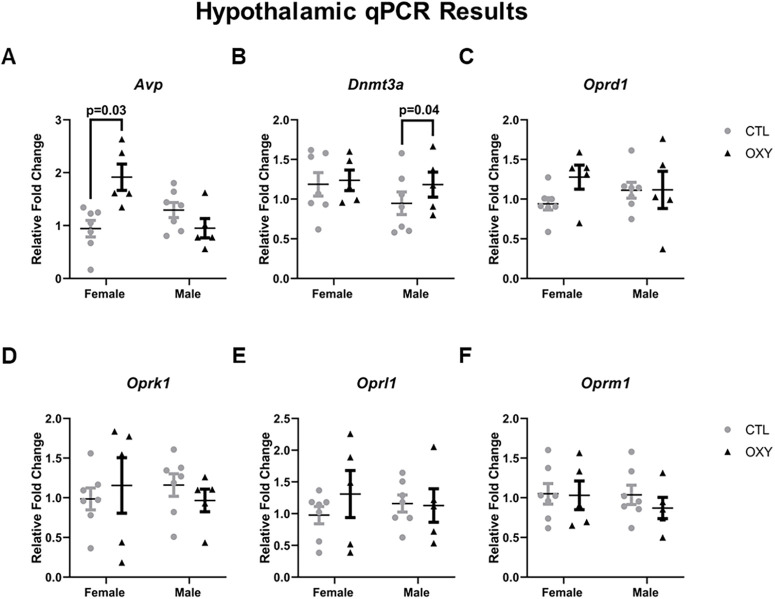
Figure 10.
Gene expression in hypothalamic tissue. Gene expression data, as determined by qPCR assay, were normalized by using combined average dCt values of the two housekeeping genes: B2m and Rpl7 and then analyzed based on treatment, sex, and their interactions, and dam was the considered experimental unit for treatment effects. Significant differences are indicated in the figures. Gene expression patterns for: A) Avp; B) Dnmt3a; C) Oprd1; D) Oprk1; E) Oprl1; F) Oprm1. Number of replicates tested = seven female and seven male mice for CTL group, five female and five male mice for OXY group. Additional qPCR hippocampal results are included in Extended Data Figure 10-1.

