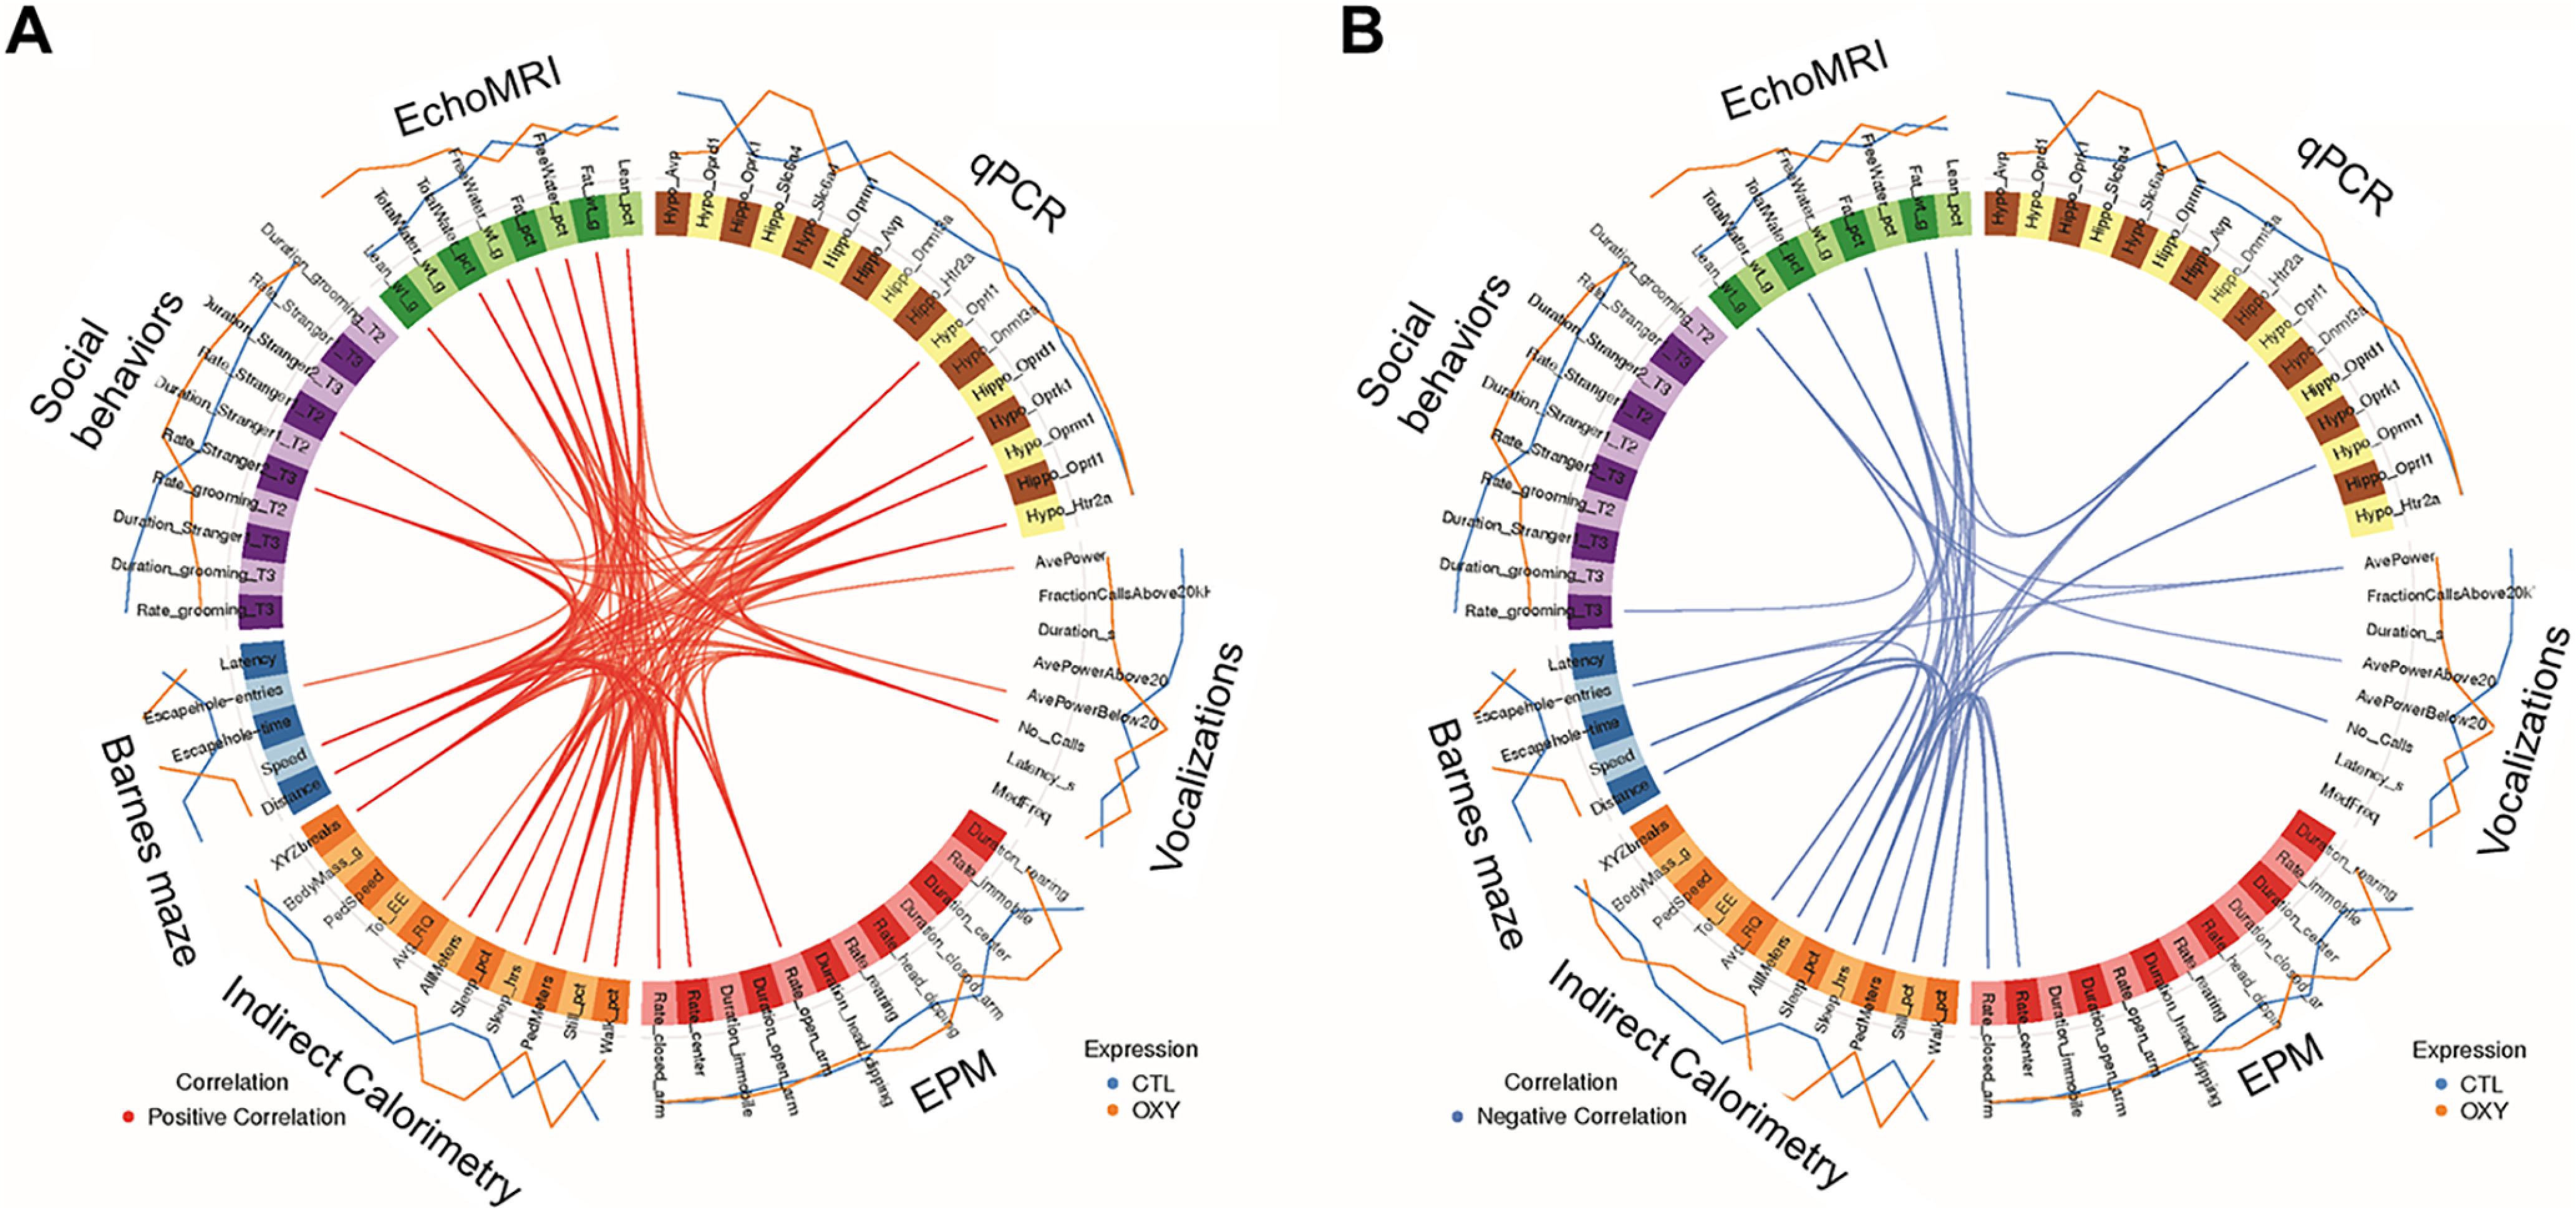
Figure 11.

Circos plot correlations for OXY-exposed versus CTL female mice. mixOmics R program (v6.1.1) was used to correlate Barnes maze, social, EPM, indirect calorimetry, echoMRI, and gene expression data. Correlation cutoff was set to 0.75. Red lines in the center indicate a positive correlation (A), whereas blue lines (B) indicate a negative correlation. Lines on the outside of the circle indicate whether the value was greater in CTL (blue) versus OXY (orange).
