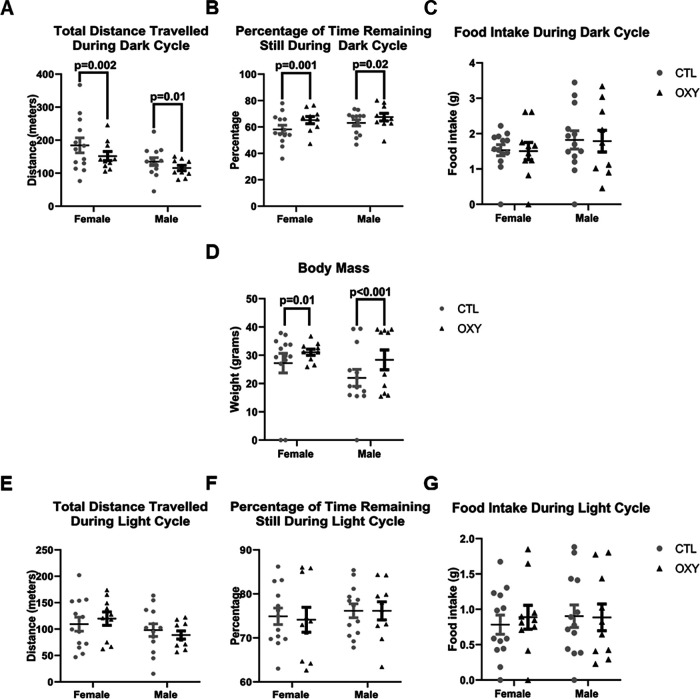
Figure 8.
Indirect calorimetry and body mass results. A, Total distance traveled during the dark cycle. B, Percentage of time remaining still during the dark cycle. C, Food intake during the dark cycle. D, Body mass. E, Total distance traveled during the light cycle. F, Percentage of time remaining still during the light cycle. G, Food intake during the light cycle. Data were analyzed with nested design and dam as experimental unit for treatment effects with treatment, sex, light cycle, and interactions between each of these factors as main effects. To illustrate possible sex differences, data are plotted separately for each sex. Significant differences are indicated in the figures. Number of replicates tested = 13 female and 13 male mice for CTL group, 10 female and 10 male mice for OXY group.

