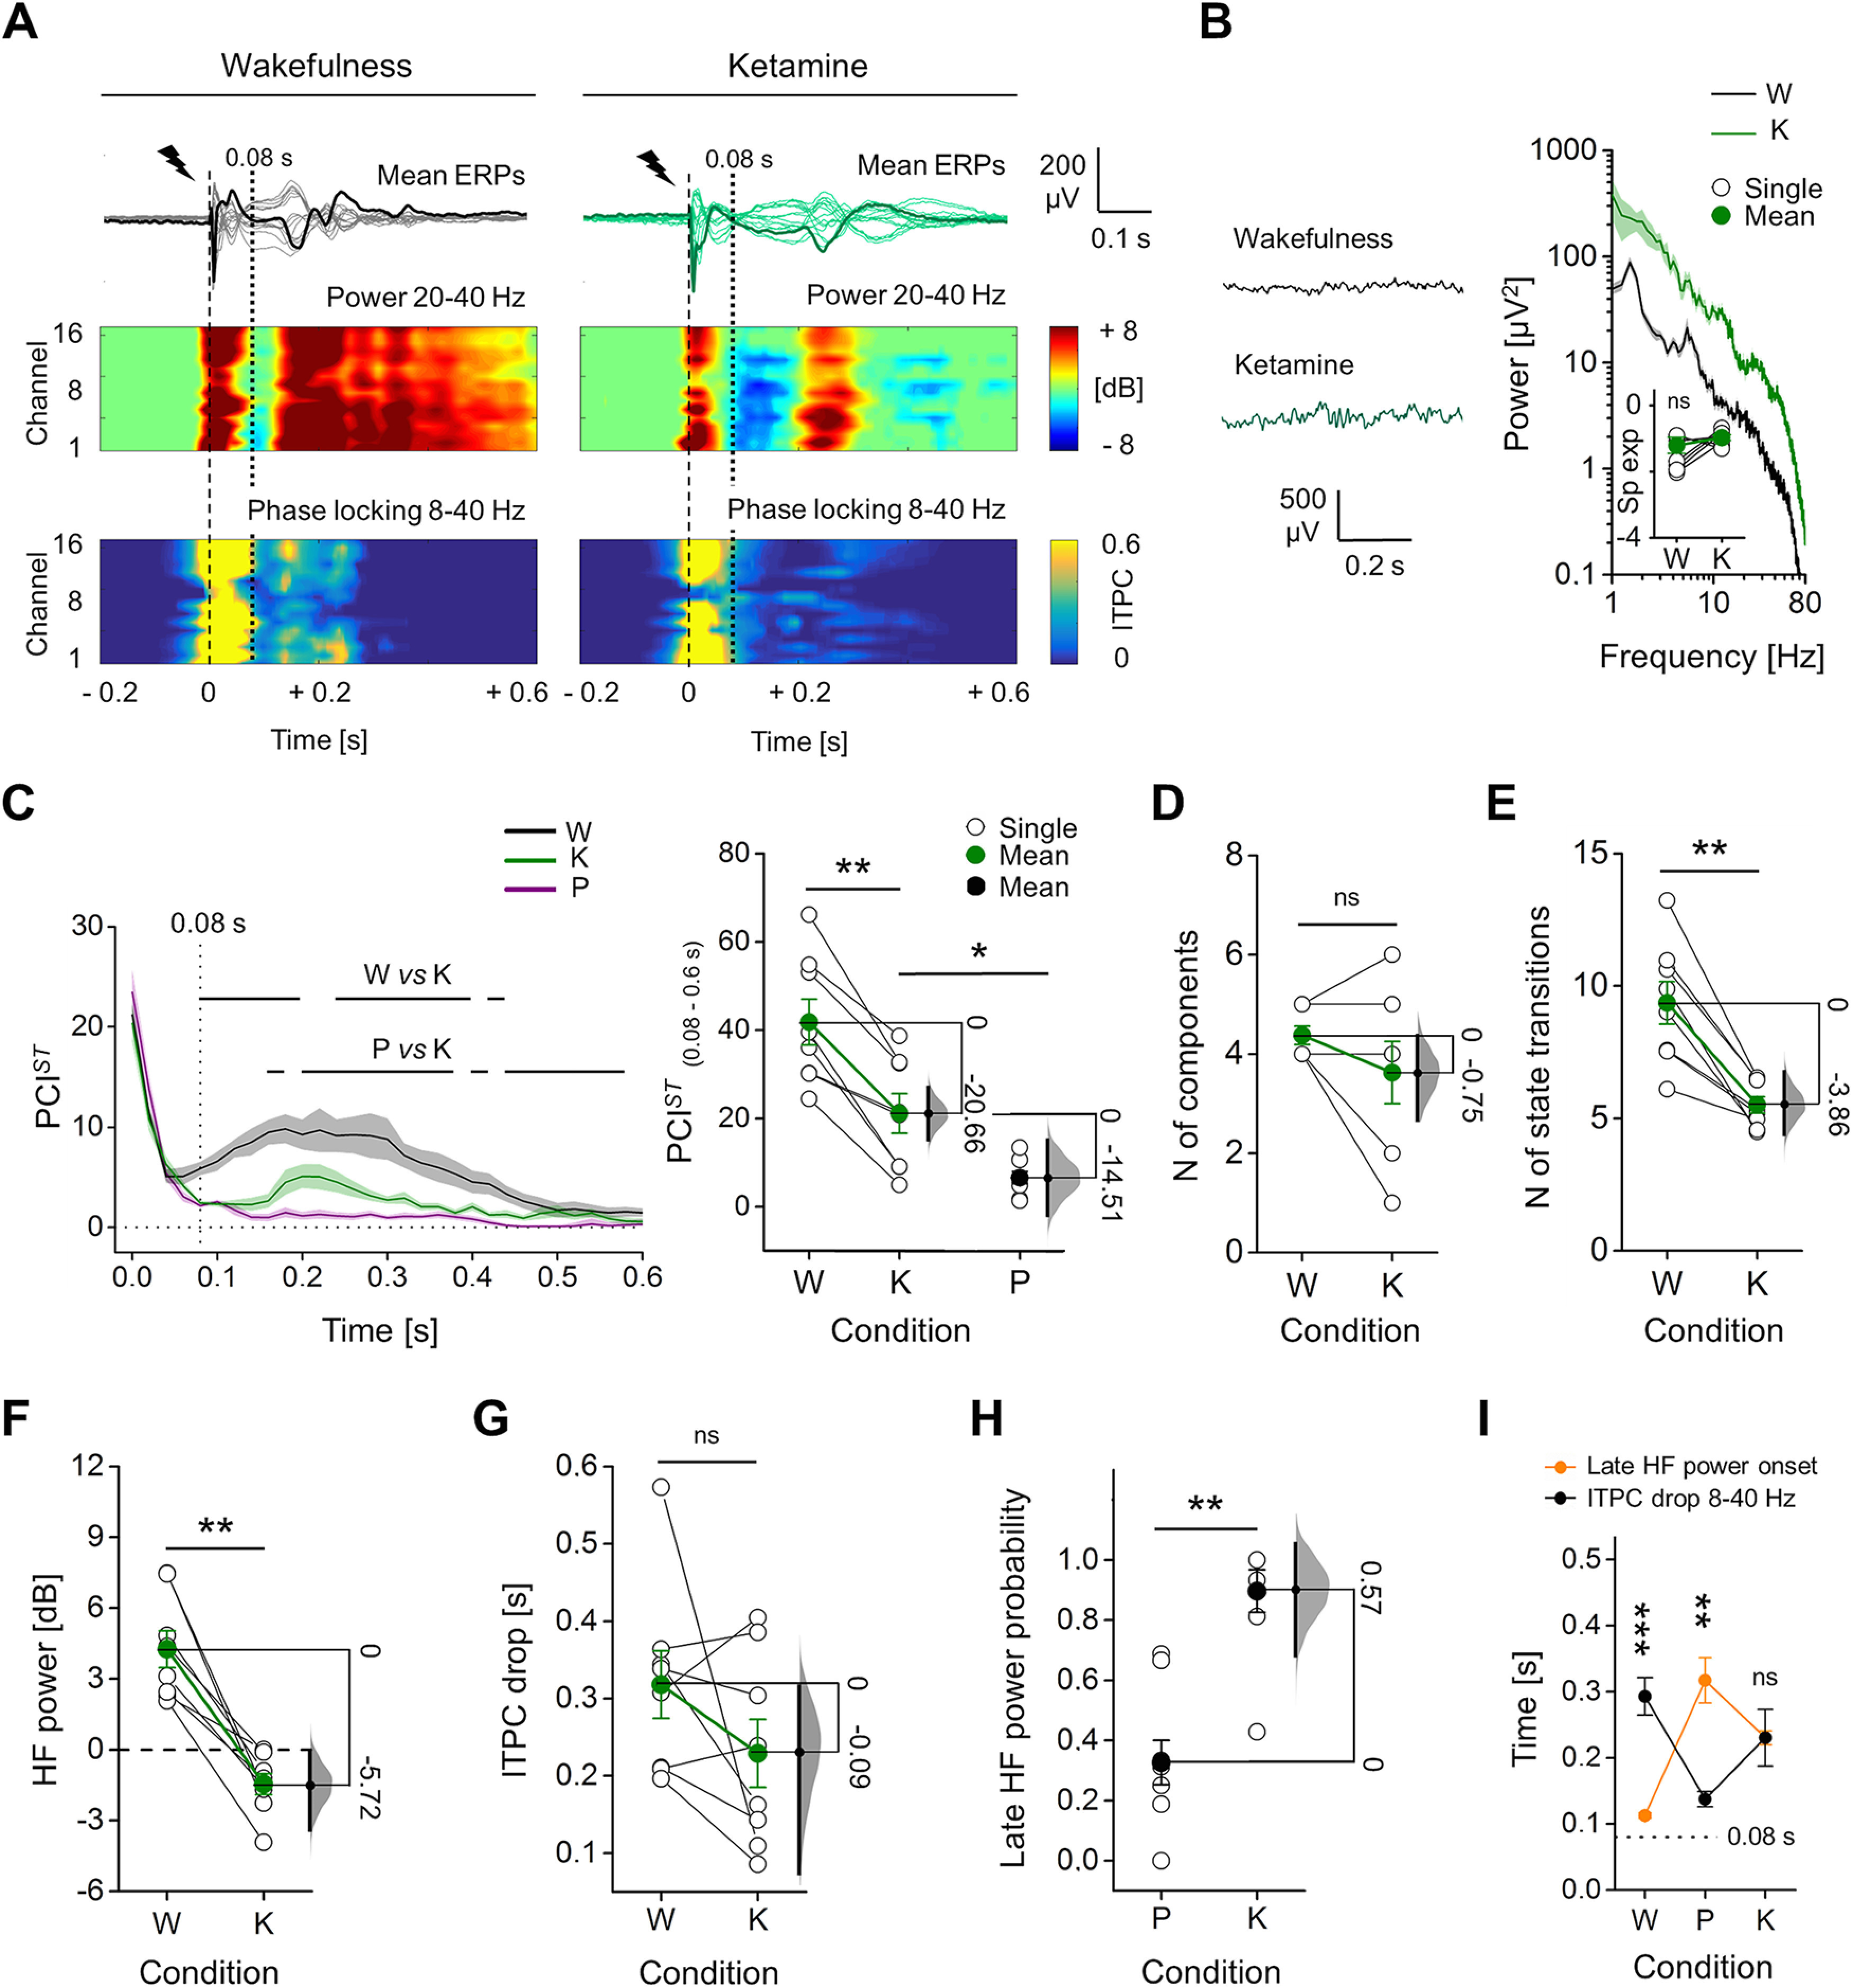
Figure 4.

ERPs with ketamine showed intermediate PCIST, with HF suppression, but sustained ITPC. A, Mean ERPs from all electrodes in response to single pulse stimulation (1 ms, 50 μA; dashed line) shown superimposed, from the same rat during wakefulness and ketamine anesthesia. One averaged ERP from the same channel (M2) is in bold for clarity. Spectrograms of HF power and ITPC for all channels are shown below. Vertical dotted line at 0.08 s indicates the average time of onset of HF suppression. B, Spontaneous EEG (left) and relative mean periodograms (shades represent SEM; right) are shown from one rat during wakefulness (W) and ketamine anesthesia (K). Spectral exponents from all rats are also shown (inset). C, left, Time courses of mean PCIST in wakefulness, ketamine, and propofol (P) anesthesia (shades represent SEM; horizontal lines indicate periods of statistical difference, p < 0.05). Right, PCISTin range 0.08–0.6 s is shown for each rat. Propofol data are the same as in Figure 1. D, Number of principal components and E, average state transitions of EEG response are shown for all rats. Mean HF power (in range 0.08–0.18 s; F) and time of ITPC drop averaged (G) across channels are shown for all animals during wakefulness and ketamine anesthesia. H, Ratio between the number of electrodes (channels) with a late increase in HF power (after 0.08 s) and the total number of channels. I, Temporal differences between the onset of the late HF power and ITPC drop are shown. The floating axis on the right of each simple group comparison (panels C, right, to H) shows the mean difference between conditions. The effect size is reported as bootstrap resampling distribution of mean difference, with 95% CI represented by the bold black vertical line. See Extended Data Figure 4-1 for in depth comparison with sevoflurane anesthesia.
