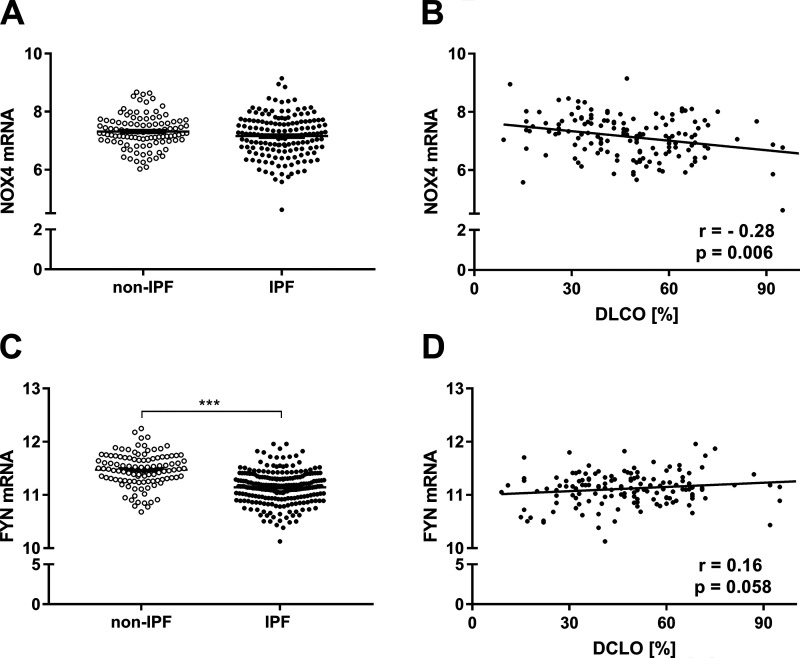
Figure 7.
NOX4 and FYN mRNA expression in controls (n = 105) and IPF patients (n = 159). A: NOX4 expression levels in lung tissues from IPF patients and controls. B: correlation of NOX4 expression with DLCO (%). C: FYN expression in lungs of control subject and IPF patients. D: correlation of FYN expression with DLCO (%). Results are expressed as means ± SD. Differences between IPF patients and controls were determined by Student’s t-test and correlation between NOX4/FYN and DLCO was analyzed by Pearson’s correlation (***P < 0.001).

