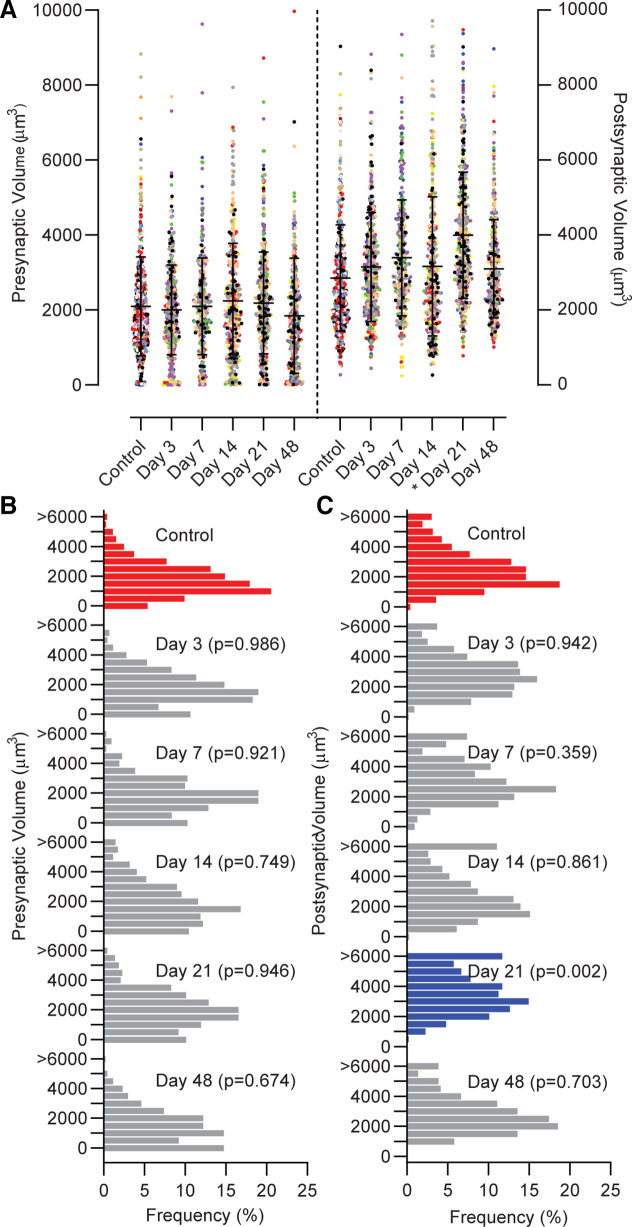
Figure 4.
A: the volume of the presynaptic terminal was similar in control and VML-injured NMJs (P = 0.667). The postsynaptic 3-D volume was significantly larger at 21 days post-VML compared with control (noted by *P = 0.005). Data were analyzed using a mixed linear model where the random effect of animal was significant (presynaptic P < 0.001; postsynaptic P < 0.001). Data are presented as overall group means ± SD; additionally each dot represents an individual NMJ and each color represents an individual muscle. B: the presynaptic volume distribution was similar for all groups, and there was a shift toward larger (C) postsynaptic volume distributions at day 21 as determined by chi-square analysis compared with control (P < 0.05). Red bars represent controls, blue bars indicate significantly different from controls, and gray bars indicate no difference from control; individual P values are noted at each group. NMJ, neuromuscular junctions; VML, volumetric muscle loss.

