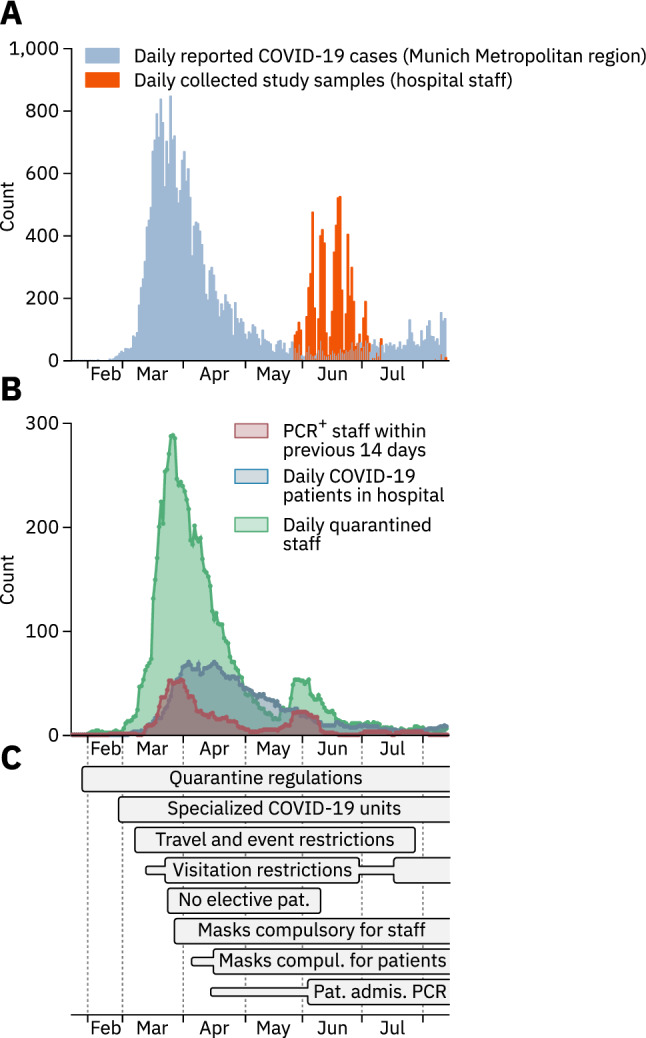
Fig. 1.

Dynamics of the COVID-19 pandemic and implementation of preventive measures. a COVID-19 cases officially reported for the Munich metropolitan region until August 12th, 2020 (blue) and the number of blood samples collected from staff members (orange) are depicted as one bar per day. b Number of HCWs who tested positive for SARS-CoV-2 by PCR within a two-week window preceding the reported date (red), number of COVID-19 patients treated in the hospital (blue), and number of hospital staff in quarantine (green). c Time-resolved depiction of state-imposed and institutional measures taken to prevent SARS-CoV-2 spread at the multicenter hospital. Thinner, horizontal bars represent less strict measures of the same type. Measures that were still in effect by August 12th, 2020 are depicted as bars with open endings. Pat. Admis. PCR – Mandatory PCR test for newly admitted patients
