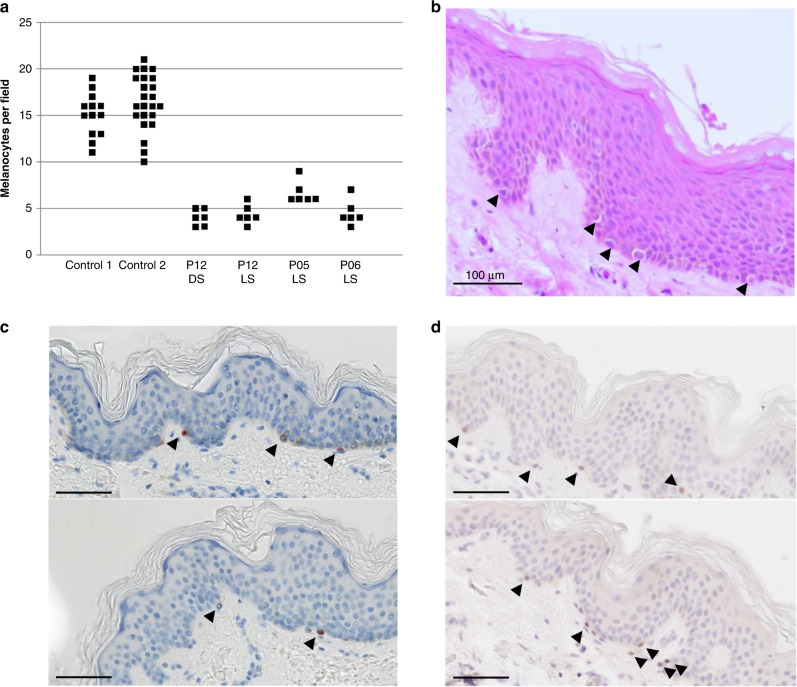
Fig. 3. Microscopy of paraffin embedded skin biopsies.
(a) Numbers of melanocytes per field on whole skin sections from patients P05, P06, and P12 (patients: 6 fields; controls: 13 and 24 fields; hematoxylin eosin [HE] staining). DS dark skin, LS light skin. (b) HE staining from P06 hypomelanotic skin. (c) Subject P12. Melan-A immunohistochemistry on skin biopsy sections from pigmented skin (top) and hypomelanotic skin (bottom). (d) Subject P12. MITF labeling on biopsy sections from pigmented skin (top) and hypomelanotic skin (bottom). Scale bar: 100 µm. Melanocytes are shown by arrowheads.

