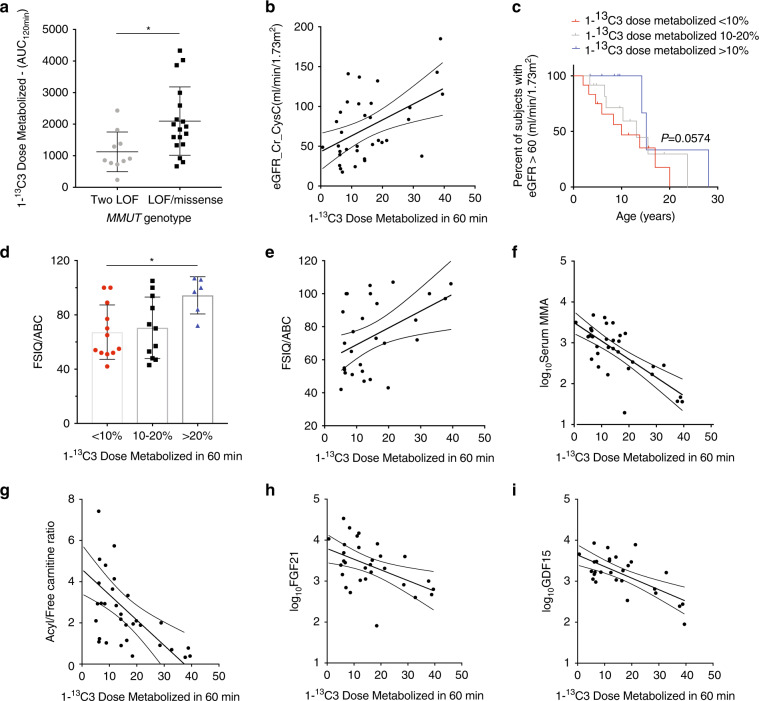
Fig. 3. 1-13C-propionate oxidation in MMUT methylmalonic acidemia (MMA) patients: correlations with clinical and biochemical parameters.
The lowest 1-13C-propionate oxidation rates were mostly observed in mut MMA patients, who harbored two loss-of-function (LOF) variants in MMUT. Comparisons reached significance for the area under the curve at 120 minutes (adjusted P = 0.0154), but with significant overlap with the compound heterozygous carrying LOF/missense or two missense variants. (b) 1-13C-propionate oxidation rates showed a positive correlation with renal function, with higher propionate oxidation subjects having a near normal estimated glomerular filtration rate (eGFR) (mL/min/1.73 m2) calculated with the combined equation using creatinine and cystatin C values (correlation coefficient r = 0.436, R2 = 0.1909, P = 0.0098). (c) Age of onset for stage 3 chronic kidney disease (CKD) (eGFR based on the bedside Schwartz equation ≤60 mL/min/1.73m2) was censored in a Kaplan–Meier curve for mut0 MMA patients stratified by their 1-13C-propionate oxidation rate. Fifty percent of patients with the lowest (<10%) propionate oxidation reached stage 3 CKD at age 8.3 years, as opposed to 15 years in patients with oxidation >20% (marked in red and blue, respectively, P = 0.0574). (d, e) Patients with the lowest 1-13C-propionate oxidation (<10%, red) had more severe intellectual impairment, based on standardized age-appropriate neurocognitive evaluations (full-scale IQ [FSIQ]) compared with patients with >20% oxidation rates (adjusted P = 0.0325, blue). Bivariate correlation coefficient r = 0.455, R2 = 0.2078, P = 0.0129. (f–i) Significant correlations are shown between 1-13C-propionate oxidation rates and clinical disease-specific serum biomarkers, including serum methylmalonic acid (r = −0.739, R2 = 0.547, P < 0.0001, log transformed values were used for skewed variables); acyl/free carnitine ratio (r = −0.584, R2 = 0.341, P < 0.0004), as well as biomarkers of hepatic or multisystem mitochondrial dysfunction (FGF21, fibroblast growth factor 21: r = −0.486, R2 = 0.237, P < 0.0064 and GDF15, growth differentiation factor 15: r = −0.664, R2 = 0.4418, P < 0.0001).

