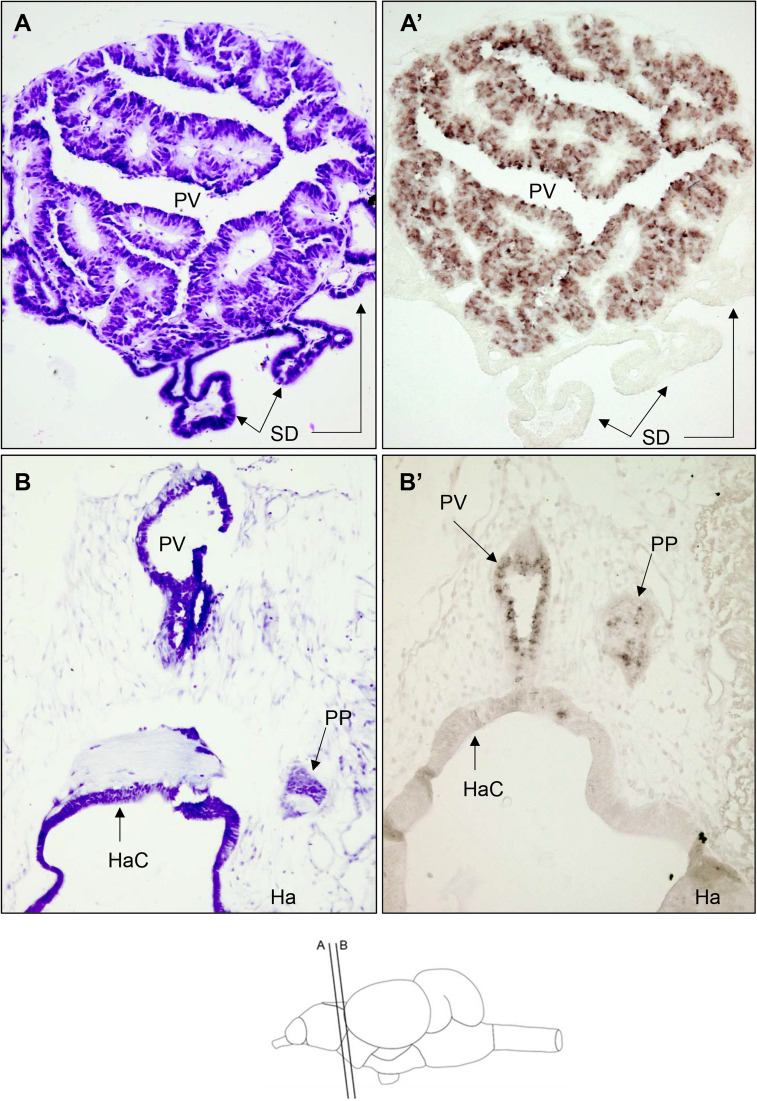
Fig. 1.
Bright-field photomicrographs of transverse sections of the rainbow trout brain at the level of rostral diencephalon showing tph1-expressing cells. Section levels are shown in the schematic drawing at the bottom of the figure. A and B are Nissl staining with cresyl violet of transverse sections at similar rostrocaudal level of those shown in A’ and B’, respectively. A’ displays a high expression level in most cells of the pineal vesicle (PV), presumably photoreceptors (see “Discussion” for details), whereas B’ shows lower expression levels in the parapineal organ (PP). The identity of thp-expressing cells in the PP remains unknown (see “Discussion” for details). Arrows indicate the saccus dorsalis (SD) A and A’, PP, PV and habenular commissure (HaC) in B and B’. Ha habenula. Scale bar = 50 μm

