
Fig. 12.
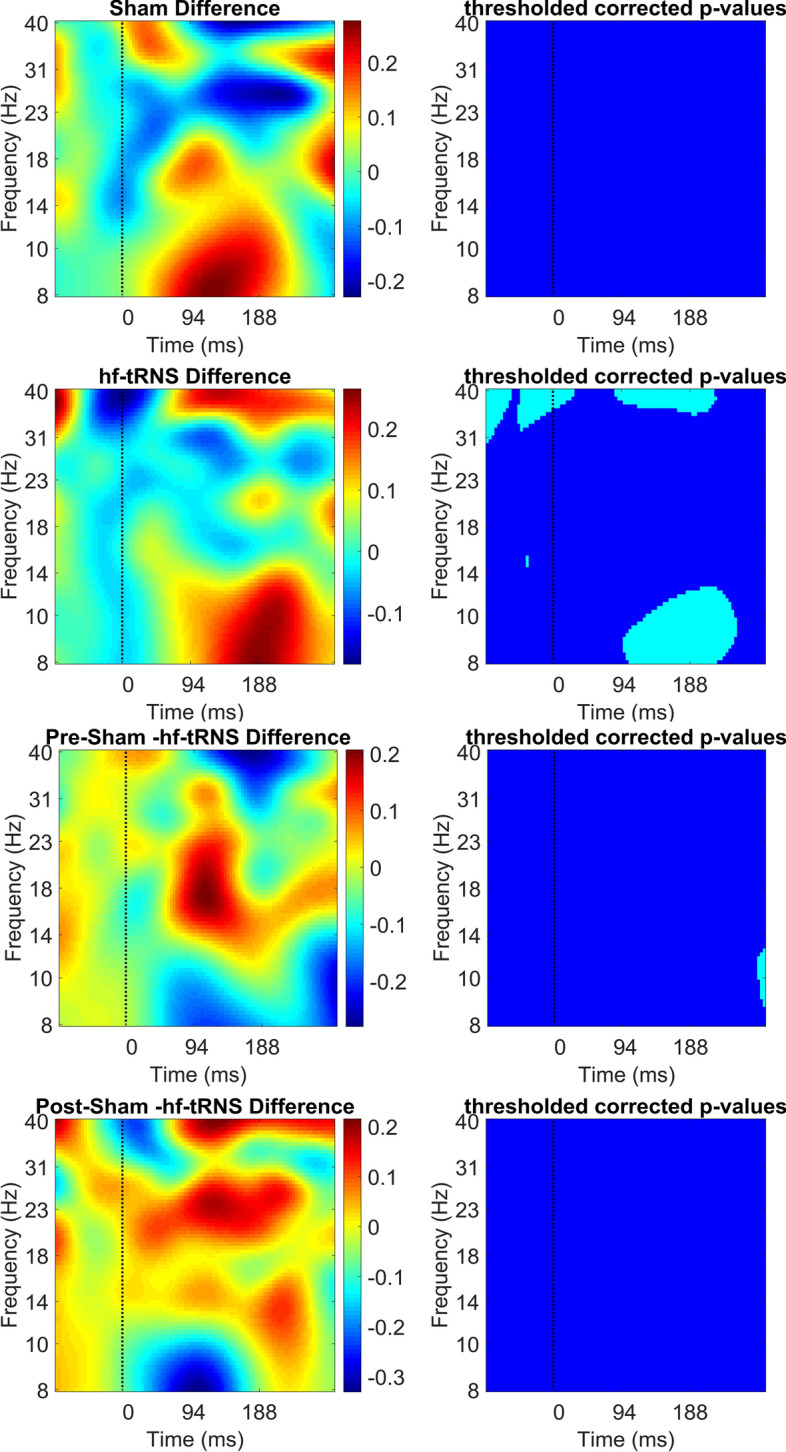
Difference in ERSP (in dB) between pre- and post-stimulation EEG for the Sham condition (first and second panel), for the hf-tRNS condition (third and fourth panel), for the pre-stimulation EEG Sham and hf-tRNS condition (fifth and sixth panel), and for post-stimulation EEG in the Sham and hf-tRNS condition (seventh and eighth panel) averaged for all the electrodes (i.e. O1, PO7, P7, P5, P3, P1, Oz, POz, Pz, O2, PO8, P8, P6, P4, and P2). Statistically significant p values (after FDR correction) are indicated as cyan, non-statistically significant p values are indicated as dark blue