Fig. 3.
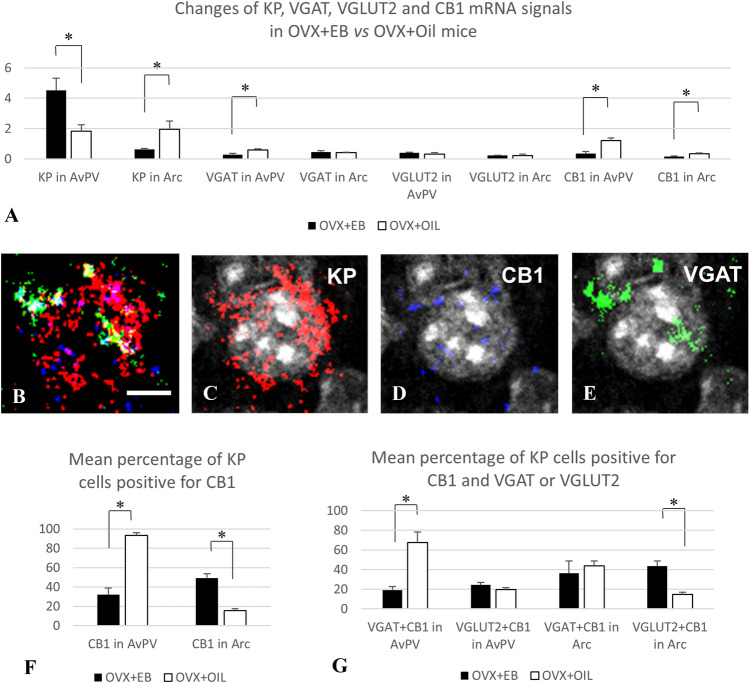
RNAscope in situ hybridization signals detected at area (A) and cellular (B–G) levels in the RP3V and Arc of OVX mice treated with EB or oil vehicle. Co-distribution of signals for KP (red), CB1 (blue), and VGAT (green) in association with a preoptic cell nucleus (grey–white) (B–E). Mean level of signals (A, determined by the number of positive pixels/ROIs in the RP3V and Arc). Expression of CB1 mRNA in KP neurons (F, determined by the presence of pixels identifying CB1 in KP mRNA-positive cells) and co-localization of CB1 mRNA signal with VGAT or VGLUT2 mRNA signals in KP mRNA-positive cells of the RP3V and Arc (G determined by the presence of pixels identifying CB1 and VGAT or VGLUT2 mRNA signals in KP mRNA-positive cells). Scale bar in B–E 5 µm p < 0.05, significant difference labeled with asterisk

