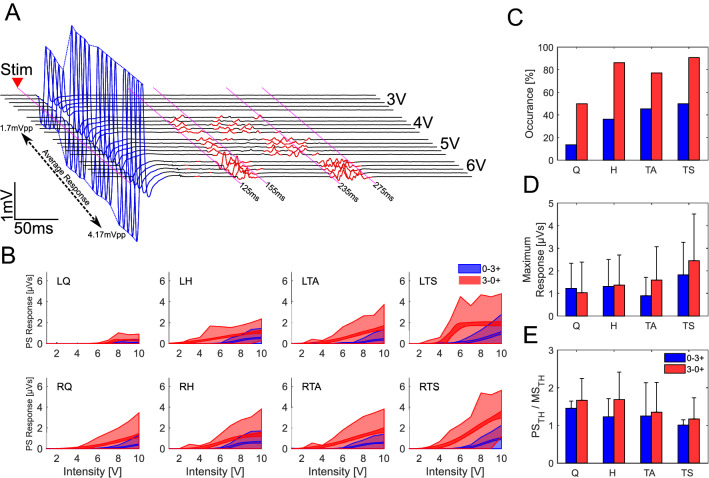
Fig. 2.
Characteristics of the Polysynaptic responses. A Exemplary responses from RH on SID 10 with 3–0 + electrode configuration. The sEMG show in blue the short-latency (monosynaptic) responses, appearing after ~ 7 ms, and, in red, the long-latency (polysynaptic) responses, which appear in two groups with latencies of around 130 ms and 260 ms. Both types of responses evolve when the stimulus intensity is increased. B Estimated recruitment curve for eight subjects (SID2 and SID8 excluded), showing the 95% confidence interval for the mean amplitude (narrowband) and standard deviation of the samples at each intensity (shadowed area) for the lower limbs with both electrode configurations. C Shows the percentage of polysynaptic activity occurrence on each muscle group (both sides grouped together). D shows the mean maximum response for each muscle and electrode configuration (SID8 excluded due to continuous activity not associated with the stimulation). Finally, E Shows the relative threshold of the polysynaptic activity compared to the monosynaptic activity

