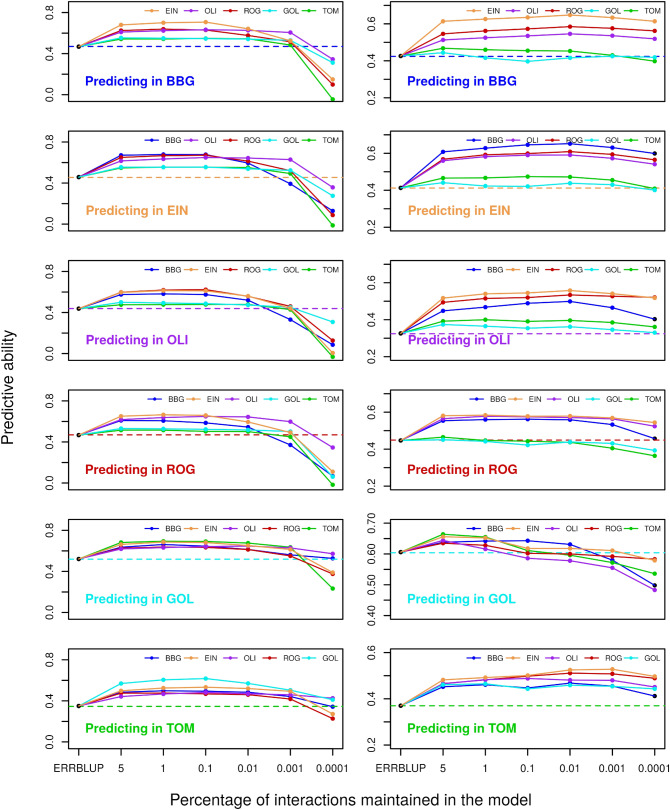
Fig. 2.
Predictive ability for univariate GBLUP within environment (dashed horizontal line), univariate ERRBLUP within environment (black filled circle), and univariate sERRBLUP across environments (solid colored lines) when SNP interaction selections are based on estimated effects variances in KE (left side) and PE (right side) for trait PH_V4. In each panel, the solid lines’ color indicates the environment in which the relationship matrices were determined by variable selection

