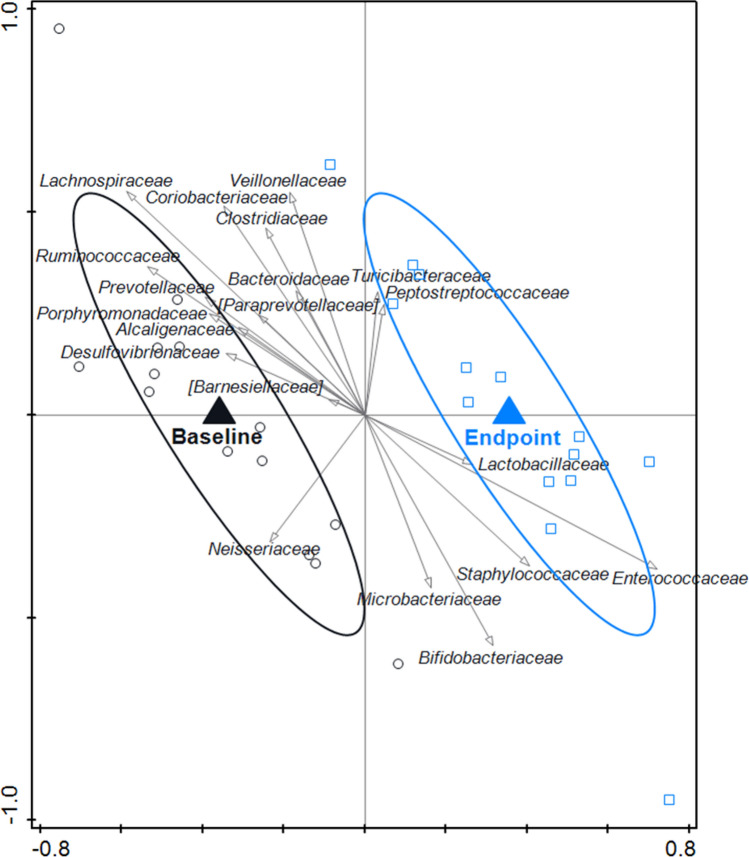
Fig. 7.
RDA on the OTU level, assessing the within-group effect of the standard MNP on the gut microbiota composition in the old-microbiome-standard MNP group. OTUs were used as response data and time point was explanatory data, the bacterial families that contributed most were plotted supplementary. The covariance attributable to subject was first fitted by regression and then partialled out (removed) from the ordination. Variation explained by time point was 2.6%, p = 0.088. The endpoint was associated with Bifidobacteriaceae and Lactobacillaceae

