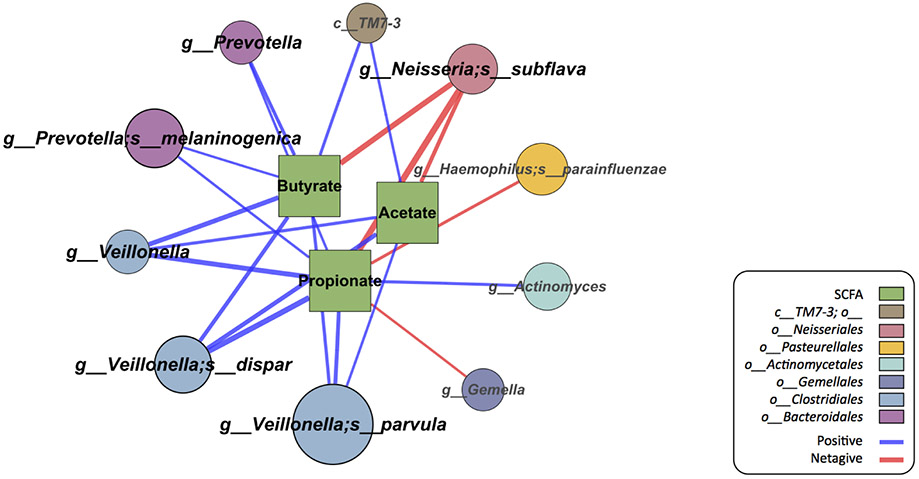
Figure 5.
Network of microbial species and short chain fatty acid (SCFA) levels. Species with relative abundance ≥ 1% are included for this analysis. The circular nodes indicate microbial species and the square nodes indicate SCFAs. The edges mark significant Spearman correlation between the microbial species and an SCFA (FDR < 0.05). The size of the circular nodes correlate with the relative abundance of each species, and the thickness of the edges correspond to the magnitude of correlation coefficients.

