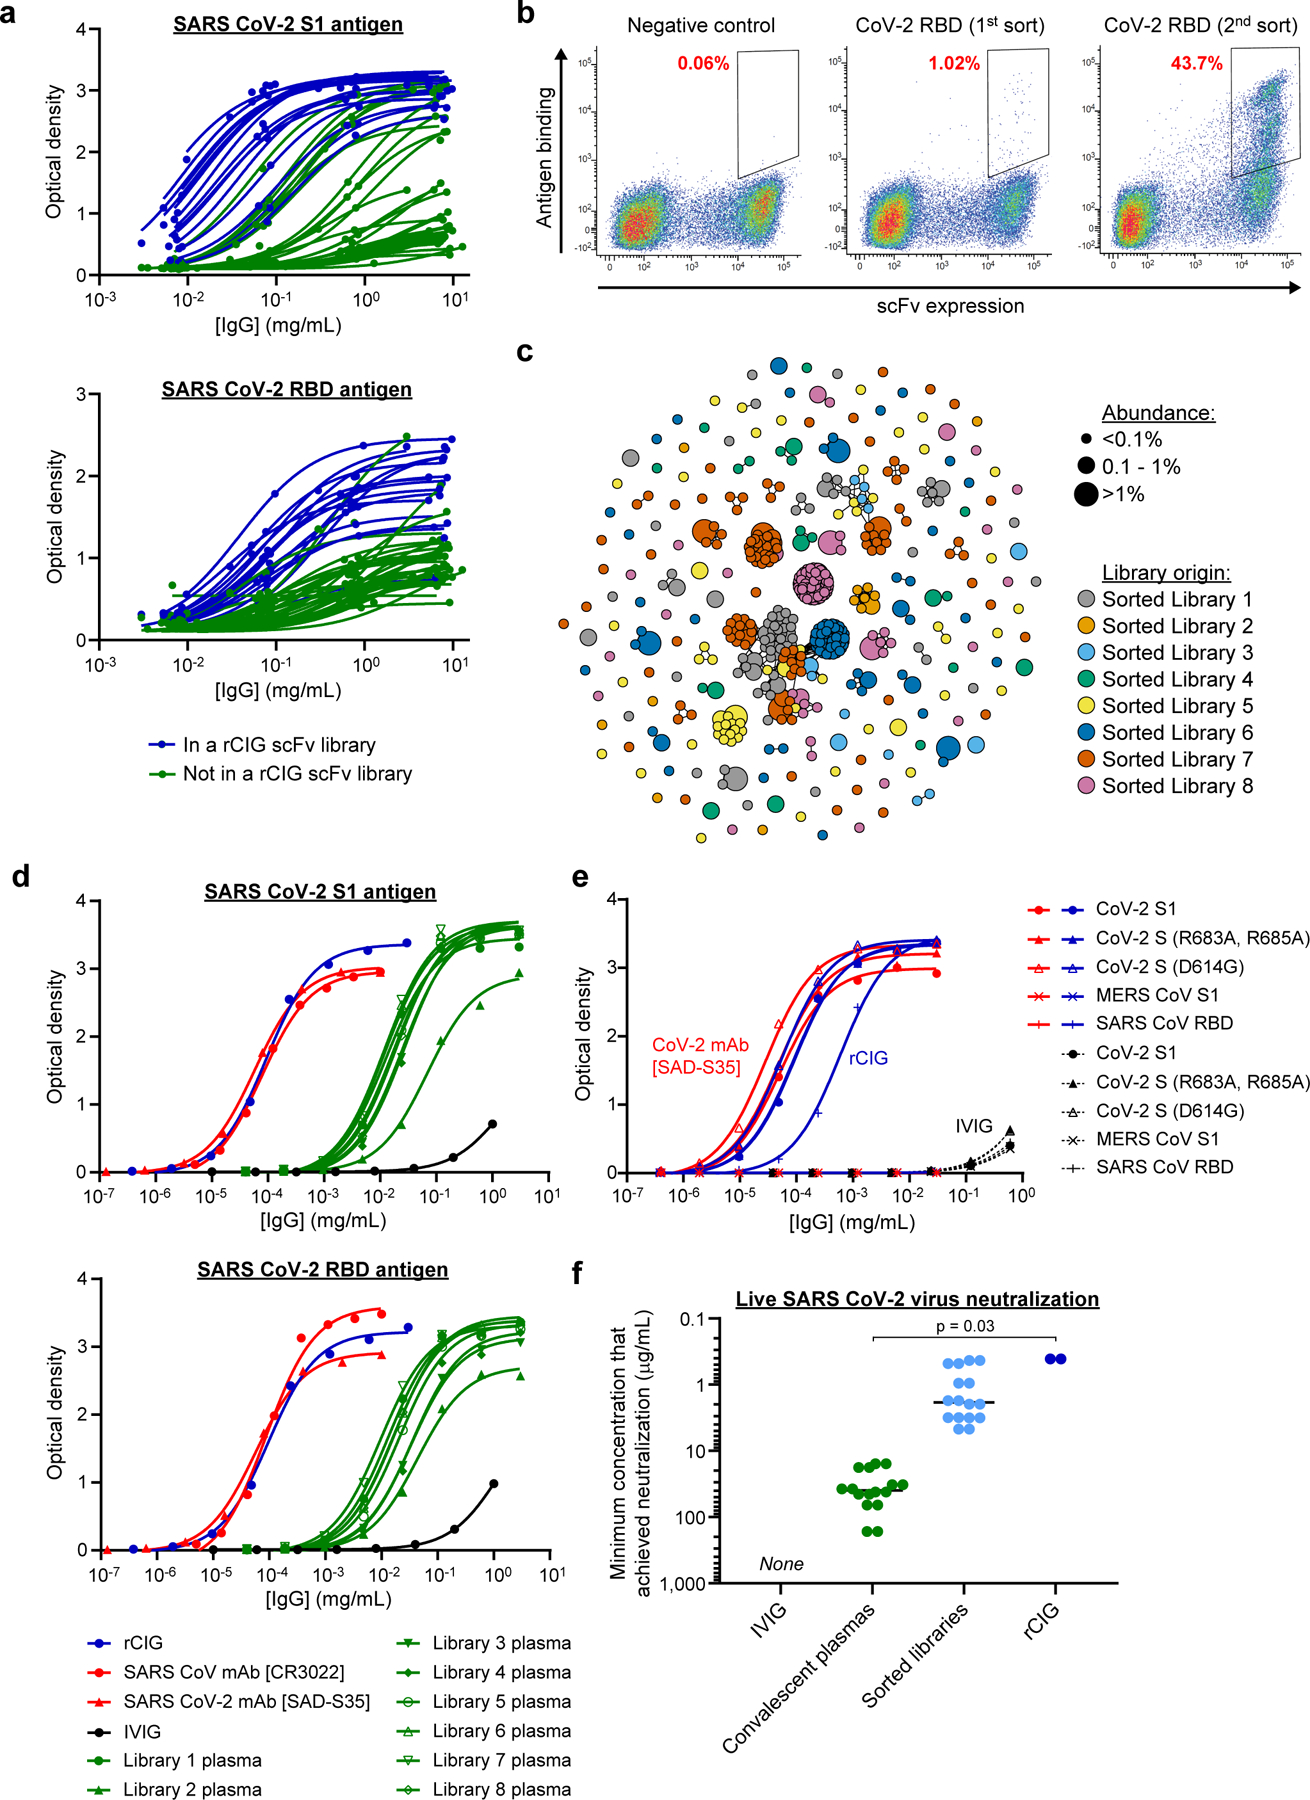
Figure 2.

Generation and characterization of a recombinant hyperimmune globulin against SARS CoV-2. (a) ELISA of individual human plasma donors against SARS CoV-2 S1 antigen (top) or RBD antigen (bottom). Dark blue indicates donors used in rCIG. Each data point represents a single measurement at a single test article dilution, in a single experiment. (b) Example FACS enrichment of scFv against CoV-2 RBD from library 1 using yeast display. The x-axis measures presence of a C-terminal c-Myc tag, indicating expression of an scFv on the surface of the cell. The y-axis measures binding of antigen to the scFv-expressing cells. The gates used for yeast selection (double positive) are indicated, with the percentage of scFv-expressed antigen binders in red. Each plot summarizes a single FACS experiment with one yeast scFv library. (c) Clonal cluster analysis of rCIG antibodies. Each node represents an antibody clone (full-length heavy chain). The color of the nodes indicates the sorted scFv library from which the CHO antibody clones were derived. The size of the nodes reflects the frequency of the clones in the final CHO cell bank (only clones ≥0.01% are plotted). We computed the total number of amino acid differences between each pairwise alignment, and edges indicate ≤5 amino acid differences. (d) ELISA of the indicated samples against SARS CoV-2 S1 antigen (top) or RBD antigen (bottom). Each data point represents a single measurement at a single test article dilution, in a single experiment. (e) ELISA of the indicated samples (indicated by the color) against the indicated antigens (different shapes). For rCIG, no binding was observed against MERS CoV S1. For the CoV-2 mAb [SAD-S35], no binding was observed against MERS CoV S1 and SARS CoV RBD. Each data point represents a single measurement at a single test article dilution, in a single experiment. (f) Live virus neutralization. Individual dots are separate test articles that represent the minimum antibody concentration that achieved neutralization. Bars represent median measurements for each test article category. Each test article was run in duplicate using different aliquots of cells and virus, in a single experiment, with the same result observed for each replicate. No neutralization was seen for IVIG. A Wilcoxon rank sum test was used to compare the minimum concentration to achieve SARS CoV-2 live virus neutralization between convalescent plasma measurements (n=16) and rCIG measurements (n=2).
