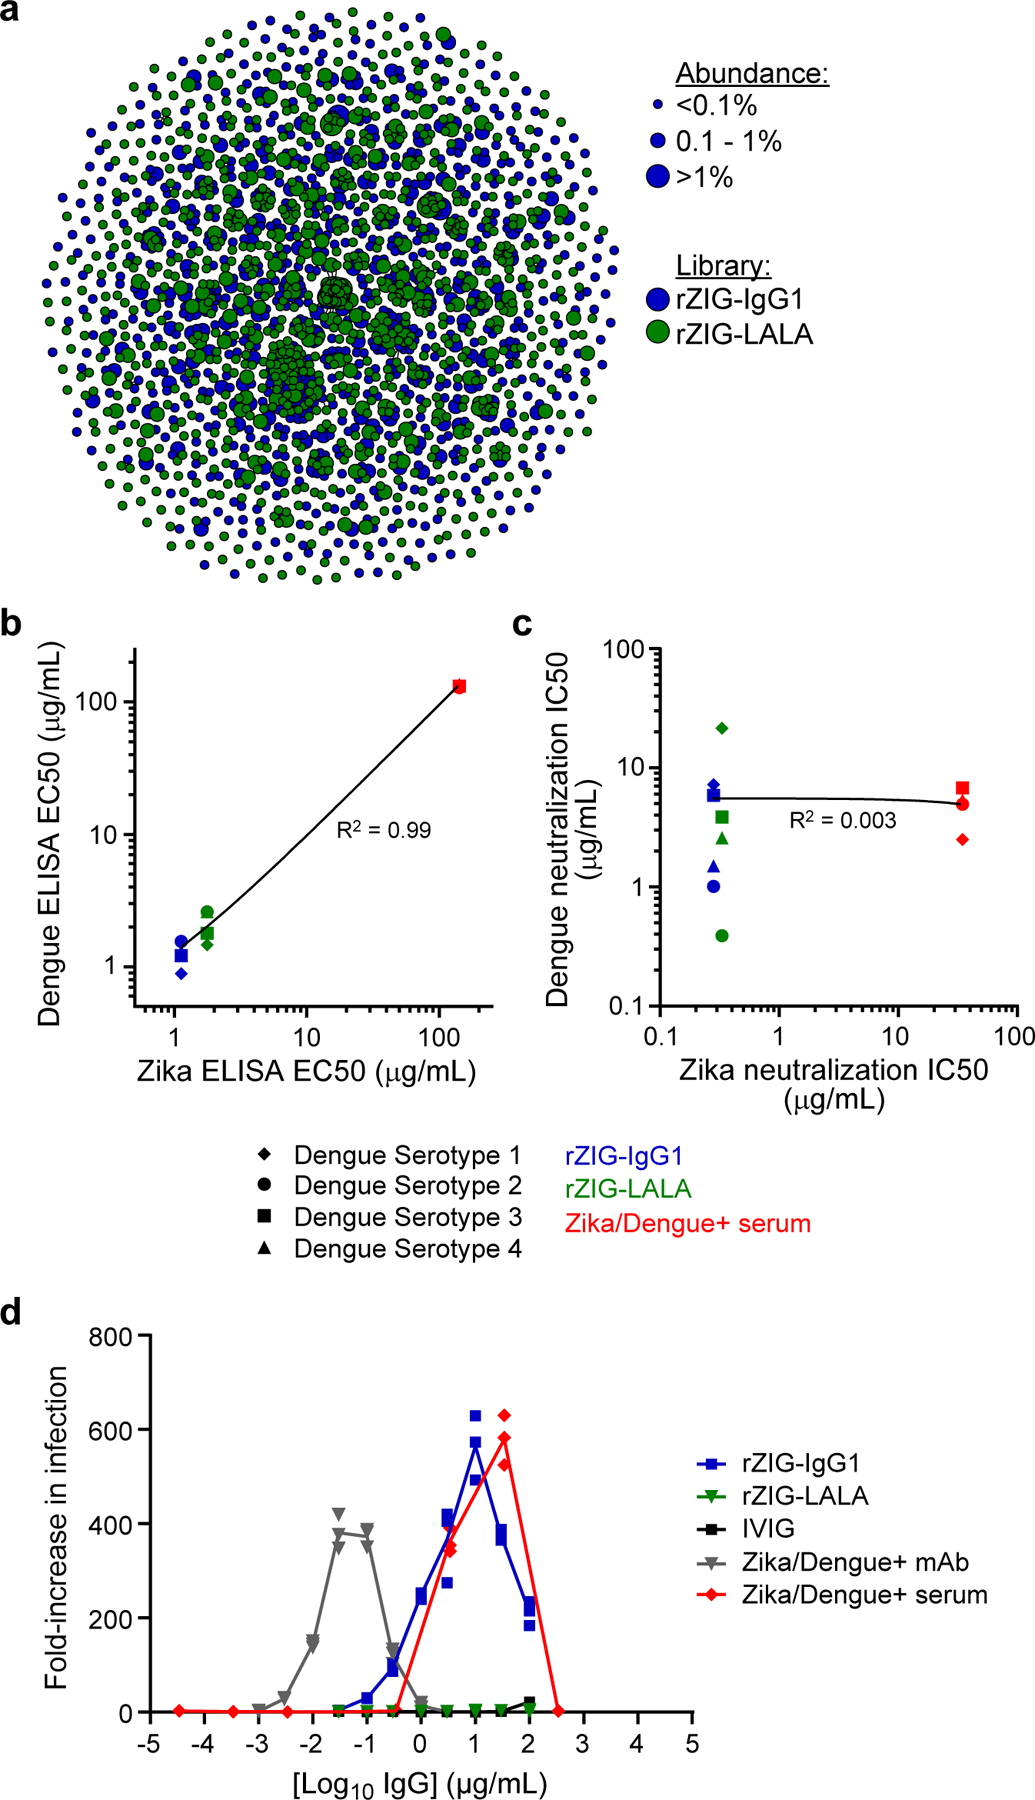
Figure 3.

Generation and characterization of a recombinant hyperimmune globulin against Zika virus. (a) Clonal cluster analysis of rZIG-IgG1 (blue) and rZIG-LALA (green) antibodies. Each node represents an antibody clone (full-length heavy chain). The size of the nodes reflects the frequency of the clones in the final CHO cell bank (only clones ≥0.01% are plotted). We computed the total number of amino acid differences between each pairwise alignment after combining both libraries together, and edges indicate ≤5 amino acid differences. (b) ELISA of rZIG-IgG1 (blue), rZIG-LALA (green), and Zika/Dengue+ serum control (red) for Dengue serotypes 1–4 (y-axis; indicated by shape) and Zika virus antigen (x-axis). Each data point represents a single test article measured against a single Dengue serotype. Linear regression trendline is indicated in black. Simple linear regression was used to calculate the coefficient of determination (R2) between Zika and Dengue ELISA EC50 values (n=7, in a single experiment). EC50 values for all Dengue serotypes were pooled for the analysis. Significance of the regression model was determined using an F-statistic with 1 and 10 degrees of freedom. (c) Pseudotype neutralization by rZIG-IgG1 (blue), rZIG-LALA (green), and Zika/Dengue+ serum control (red) for Dengue serotypes 1–4 (y-axis; indicated by shape) and Zika virus antigen (x-axis). Each data point represents a single test article measured against a single Dengue serotype, in a single experiment. Linear regression trendline is indicated in black. Simple linear regression was used to calculate the coefficient of determination (R2) between Zika and Dengue pseudotype neutralization IC50 values (n=11). IC50 values for all Dengue serotypes were pooled for the analysis. Significance of the regression model was determined using an F-statistic with 1 and 10 degrees of freedom. (d) Zika pseudotype virus ADE assay for rZIG-IgG1 (blue), rZIG-LALA (green), and positive and negative controls. Test article concentration is on the x-axis. Fold-increase infection is on the y-axis, which was the infection-induced luciferase signal observed in the presence of antibody divided by the luciferase signal observed with a no antibody control. Each data point represents a single measurement at a single test article dilution, in a single experiment.
