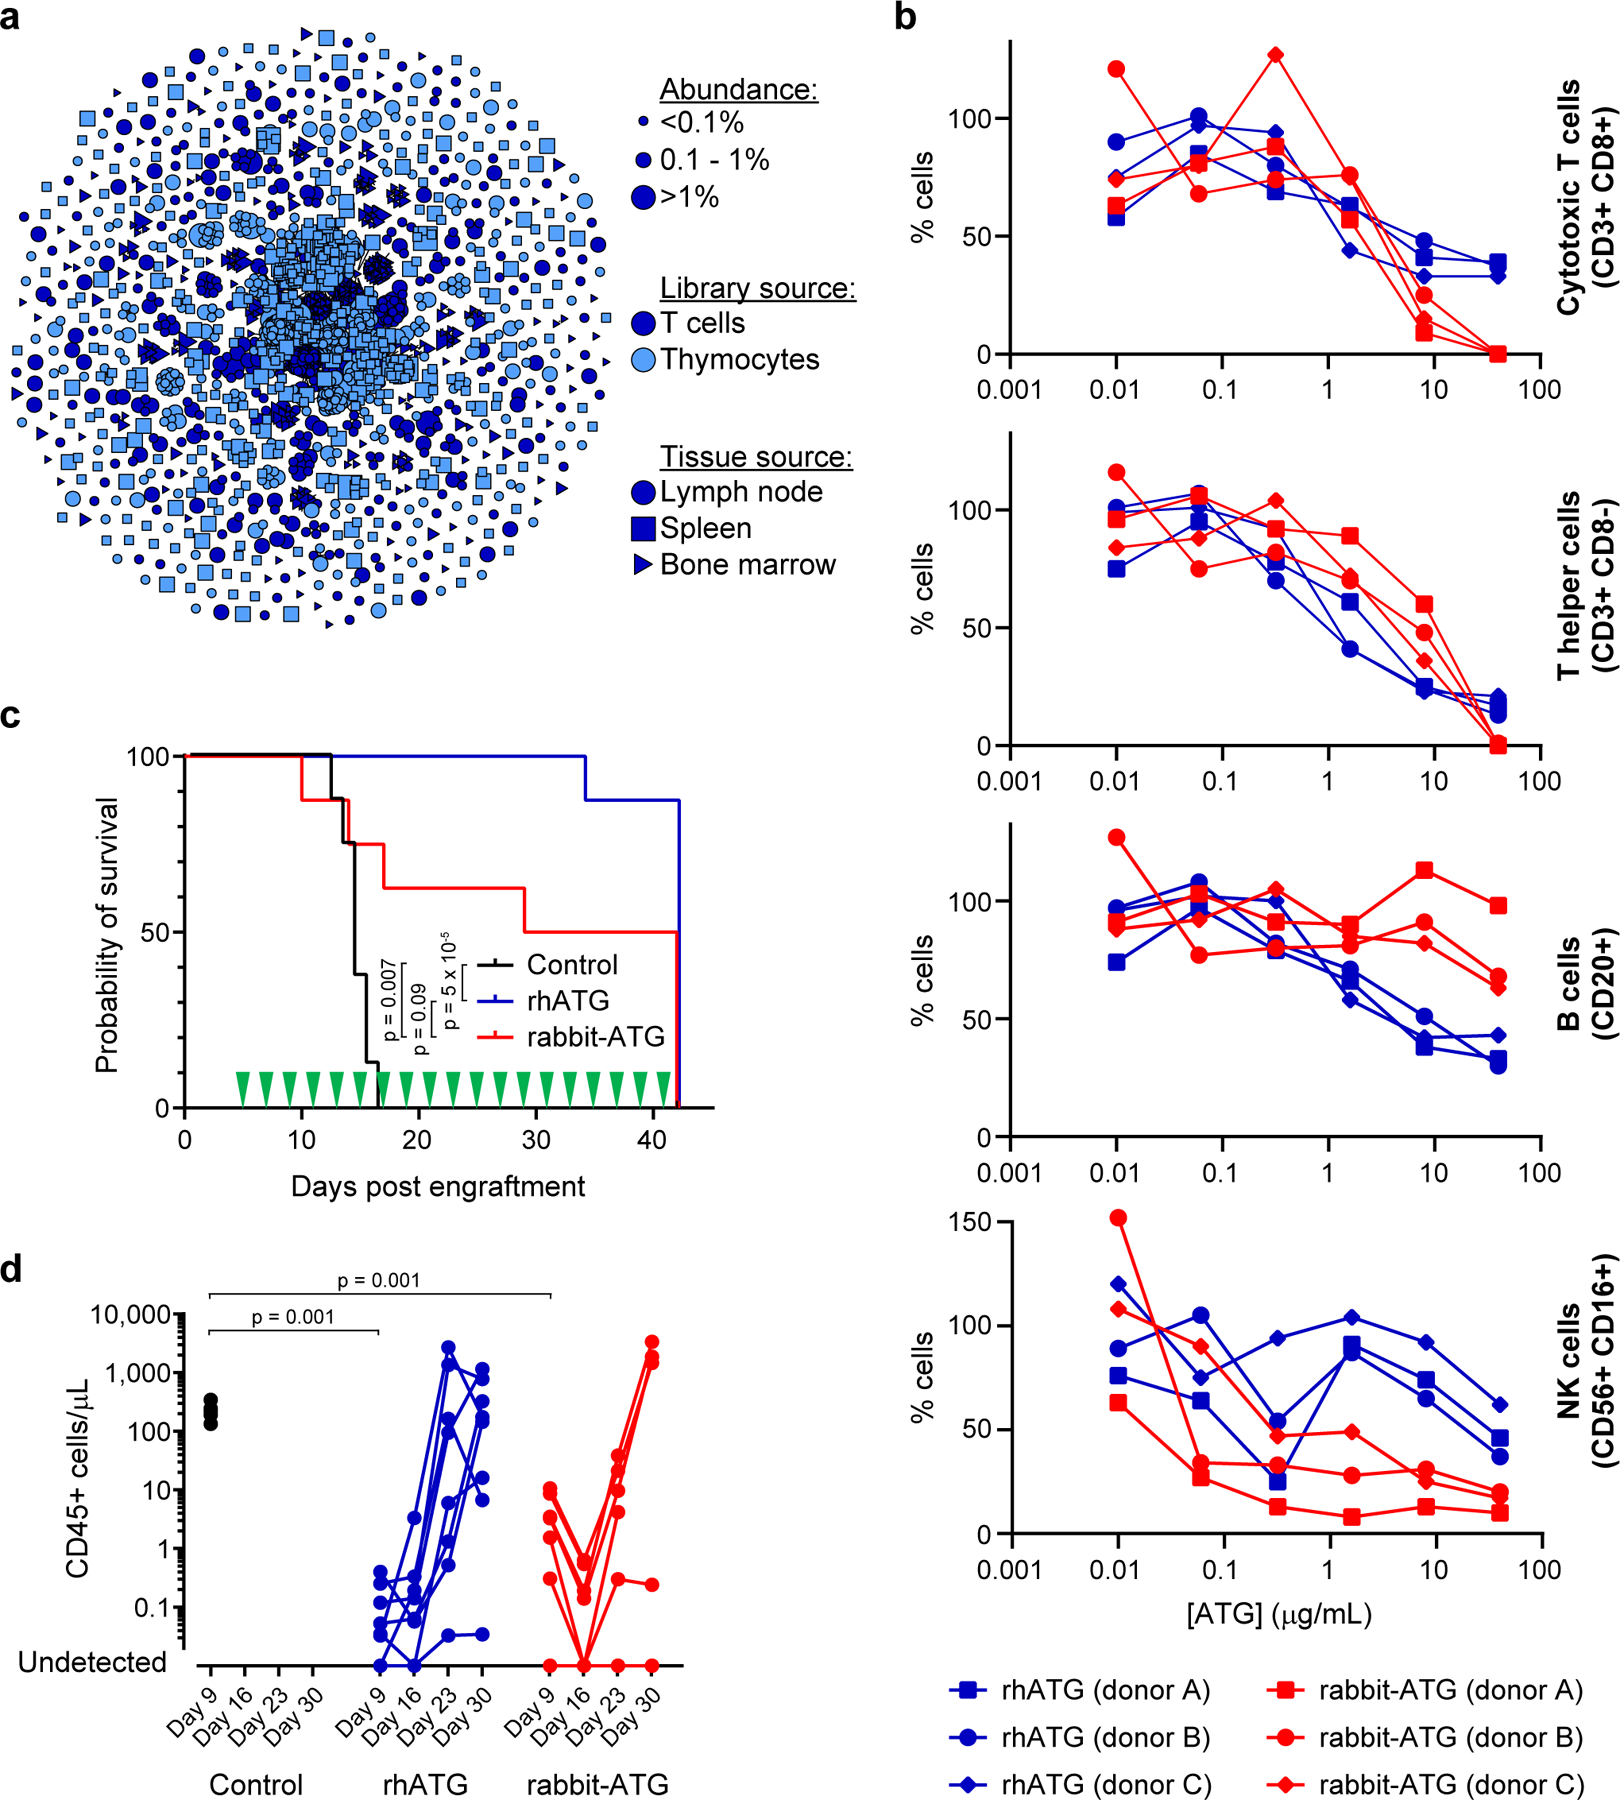
Figure 5.

Generation and characterization of a recombinant human anti-thymocyte globulin (rhATG). (a) Clonal cluster analysis of rhATG antibodies. Each node represents an antibody clone (full-length heavy chain). The color of the nodes indicates the immunized library source. The shape of the nodes indicates the mouse tissue origin. The size of the nodes reflects the frequency of the clones in the final CHO cell bank (only clones ≥0.01% are plotted). We computed the total number of amino acid differences between each pairwise alignment, and edges indicate ≤5 amino acid differences. (b) Cell killing assays of a dilution series of rabbit-ATG (red) and rhATG (blue) with three PBMC donors. The y-axis (% cells) was determined by dividing the number of cells of the indicated cell type present after overnight incubation with the indicated amount of antibody by the number of cells of that cell type present in a no antibody control. Each data point represents a single measurement at a single test article dilution, in a single experiment. Linear mixed effects models were used to compute p-values for each of the four cell types, with group and concentration as fixed effects and PBMC donor as a random effect to account for the dependence of repeated measures. Degrees of freedom were 31 for each of the four models. (c) Survival of mice (n=8 per treatment group, in a single experiment) in the GVH study using PBMC donor 1 treated every other day with a negative vehicle control (black), rabbit-ATG (red), or rhATG (blue). Treatment days are indicated by green triangles. Kaplan-Meier survival models were fit on time to mortality and pairwise log rank tests were performed to compare median survival between treatment groups. (d) Flow cytometry was used to determine the concentration of CD45+ cells from each alive mouse on Days 9, 16, 23, and 30 of the GVH study from (c) for negative vehicle control (black circles), rhATG (blue circles), or rabbit-ATG (red circles). Lines connect measurements from each mouse. No CD45+ cells were observed where circles intercept the x-axis. Linear mixed effects models were used to compute p-values for trends in CD45+ cell counts in each of the four GVH experiments (2 PBMC donors × 2 drug dosing regimens = 4 experiments) with day as a fixed effect and PBMC donor as a random effect to account for the dependence of repeated measures. A Wilcoxon rank sum test was used to compare CD45+ cell counts on Day 9 for saline negative control vs. rhATG and saline negative control vs. rabbit-ATG, in each of the four GVH experiments (2 PBMC donors × 2 drug dosing regimens = 4 experiments).
