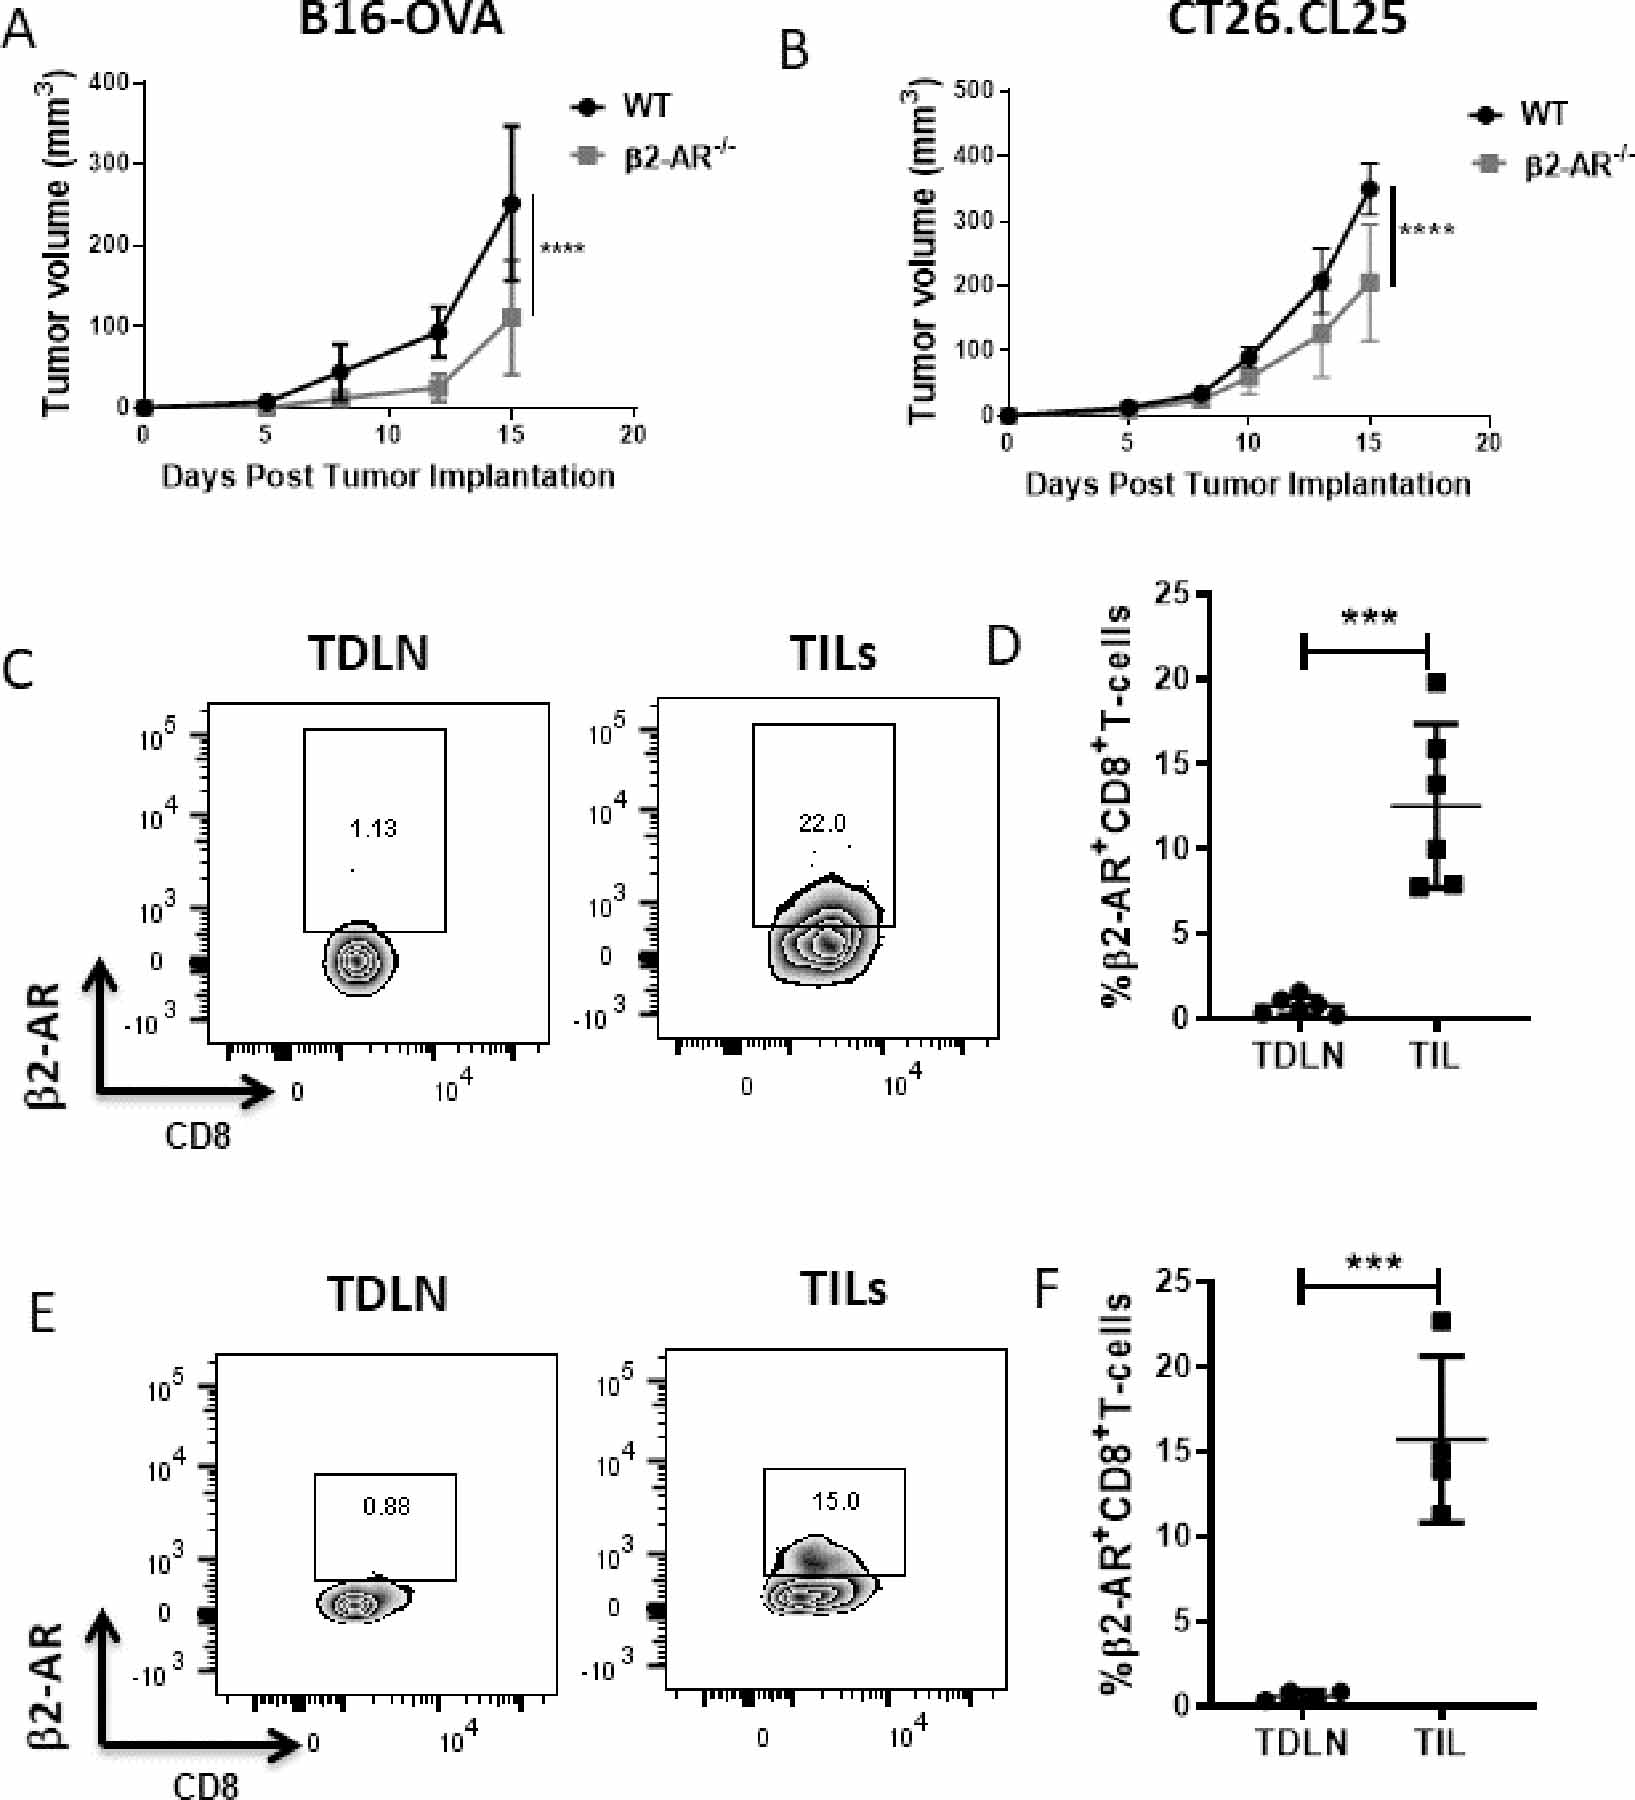
Figure 1: TILs express β2-AR, and reducing β-AR signaling decreases tumor growth.

(A) 2×10⁵ B16-OVA cells or (B) CT26.CL25 were injected into WT and β2-AR−/− C57BL/6 mice or WT and β2-AR−/− Balb/c mice, respectively. Tumor growth was monitored every 2–3 days. n=5–7/group, and tumor growth was compared using two-way ANOVA with Tukey analysis. Data are presented as mean±SD; one of two independent experiments. (C, E) Representative flow plots of β2-AR expression on CD8+ T cells from TDLNs and the TME of untreated WT mice in (C) B16-OVA and (E) CT26 models. (D, F) Frequency of β2-AR+CD8+ T cells from TDLNs and the TME in (D) B16-OVA and (F) CT26 models. n=4–6/group; data are presented as mean±SD; one of two independent experiments. Data were analyzed using unpaired Student’s t-test, ***p<0.001, ****p<0.0001.
