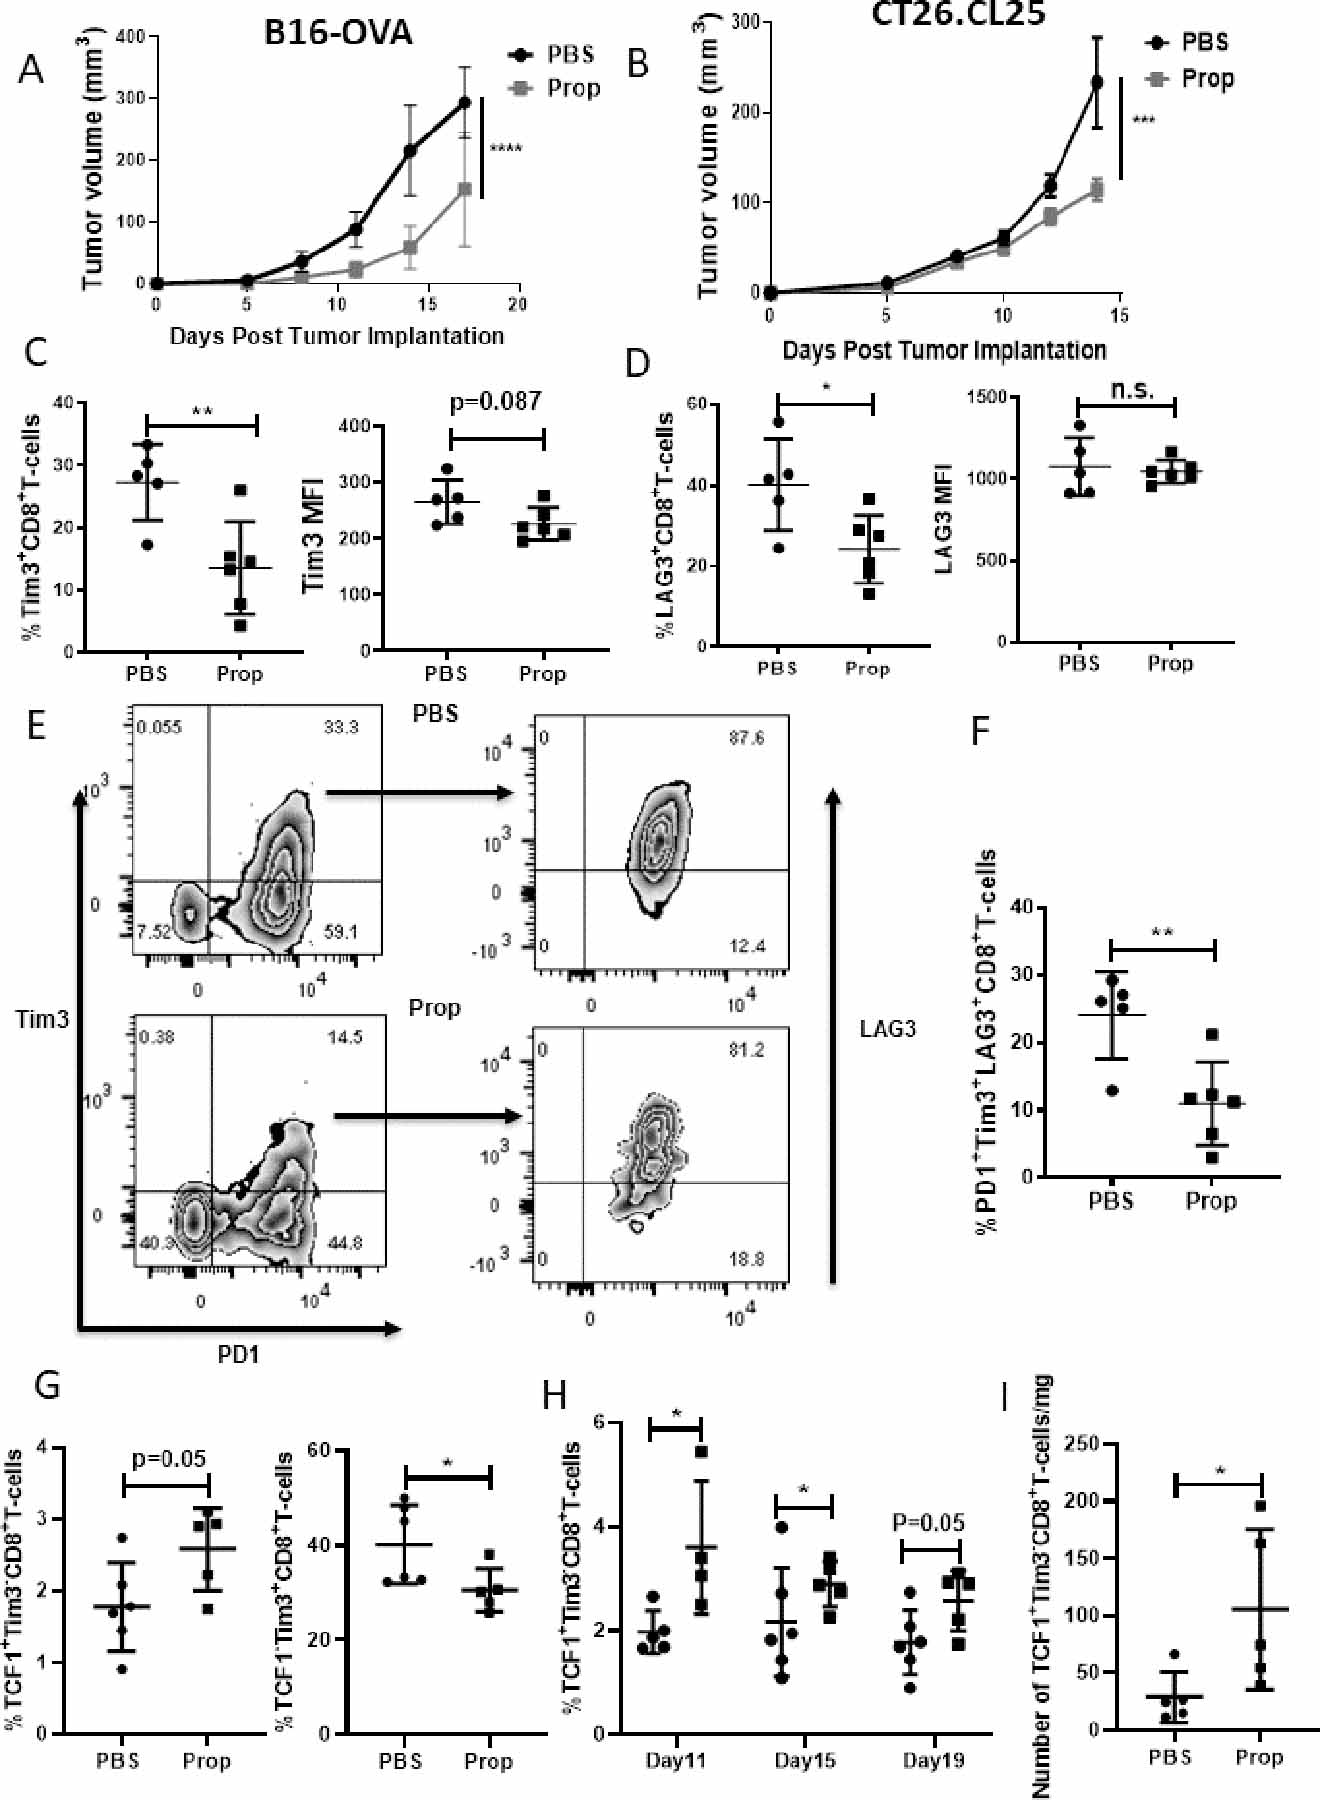
Figure 2: Blockade of adrenergic signaling in stressed mice reduces immune checkpoint receptor expression on TILs.

(A) 2×10⁵ B16-OVA or (B) CT26.CL25 cells were injected into C57BL/6 mice or Balb/c mice, respectively. Mice were treated with either PBS or propranolol (Prop, 200μg) daily starting 5 days before tumor implantation until the end of experiment, and tumor growth was monitored every 2–3 days. n=5–7/group; data are presented as mean±SD; one of two independent experiments. Tumor growth was compared using two-way ANOVA with Tukey analysis. (C-I) Single-cell suspensions were made from B16-OVA tumors of mice treated with PBS or propranolol, and TILs were analyzed by flow cytometry. (C-D) Frequency and mean fluorescence intensity (MFI) of (C) Tim3+ and (D) LAG3+ CD8+ TILs. (E) Representative flow plots of PD1+Tim3+LAG3+CD8+ TILs. (F) Frequency of PD1+Tim3+LAG3+CD8+ TILs; n=5–6/group; data are presented as mean±SD; one of two independent experiments. (G) Frequency of progenitor (gated by CD8+>PD-1+CD44+>TCF1+Tim3-) and terminally exhausted CD8+ TILs (gated by CD8+>PD-1+CD44+>TCF1-Tim3+) from B16-OVA tumors. (H) Frequency of progenitor exhausted CD8+ TILs from B16-OVA tumors at day 11, 15, 19 after tumor implantation. (I) Absolute number of progenitor exhausted CD8+ TILs from mice treated with PBS or propranolol 7 days after tumor implantation. n=4–6/group; data are presented as mean±SD. Data were analyzed using unpaired Student’s t-test, *p<0.05, **p<0.01, ***p<0.001, ****p<0.0001.
