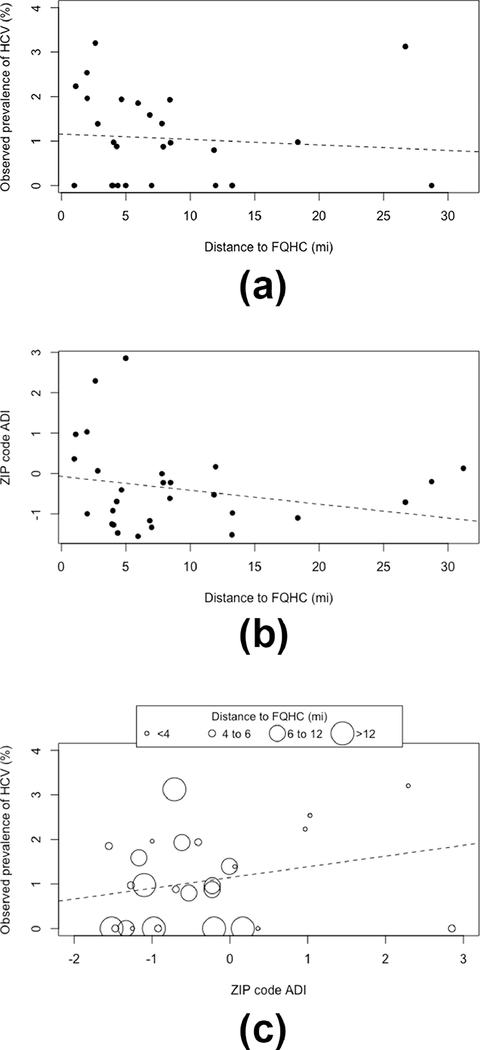
Figure 3.
Ecological plots depicting ZIP code-level associationsa between A) median distance to federally qualified health center (FQHC) by observed prevalence of chronic Hepatitis C virus (HCV) infection, B) median distance to FQHC by area deprivation index (ADI), and C) ADI by observed prevalence of HCV and median distance to FQHC, for a cohort of patients in New Castle County, Delaware, USA. Dashed lines depict line of best fit.

