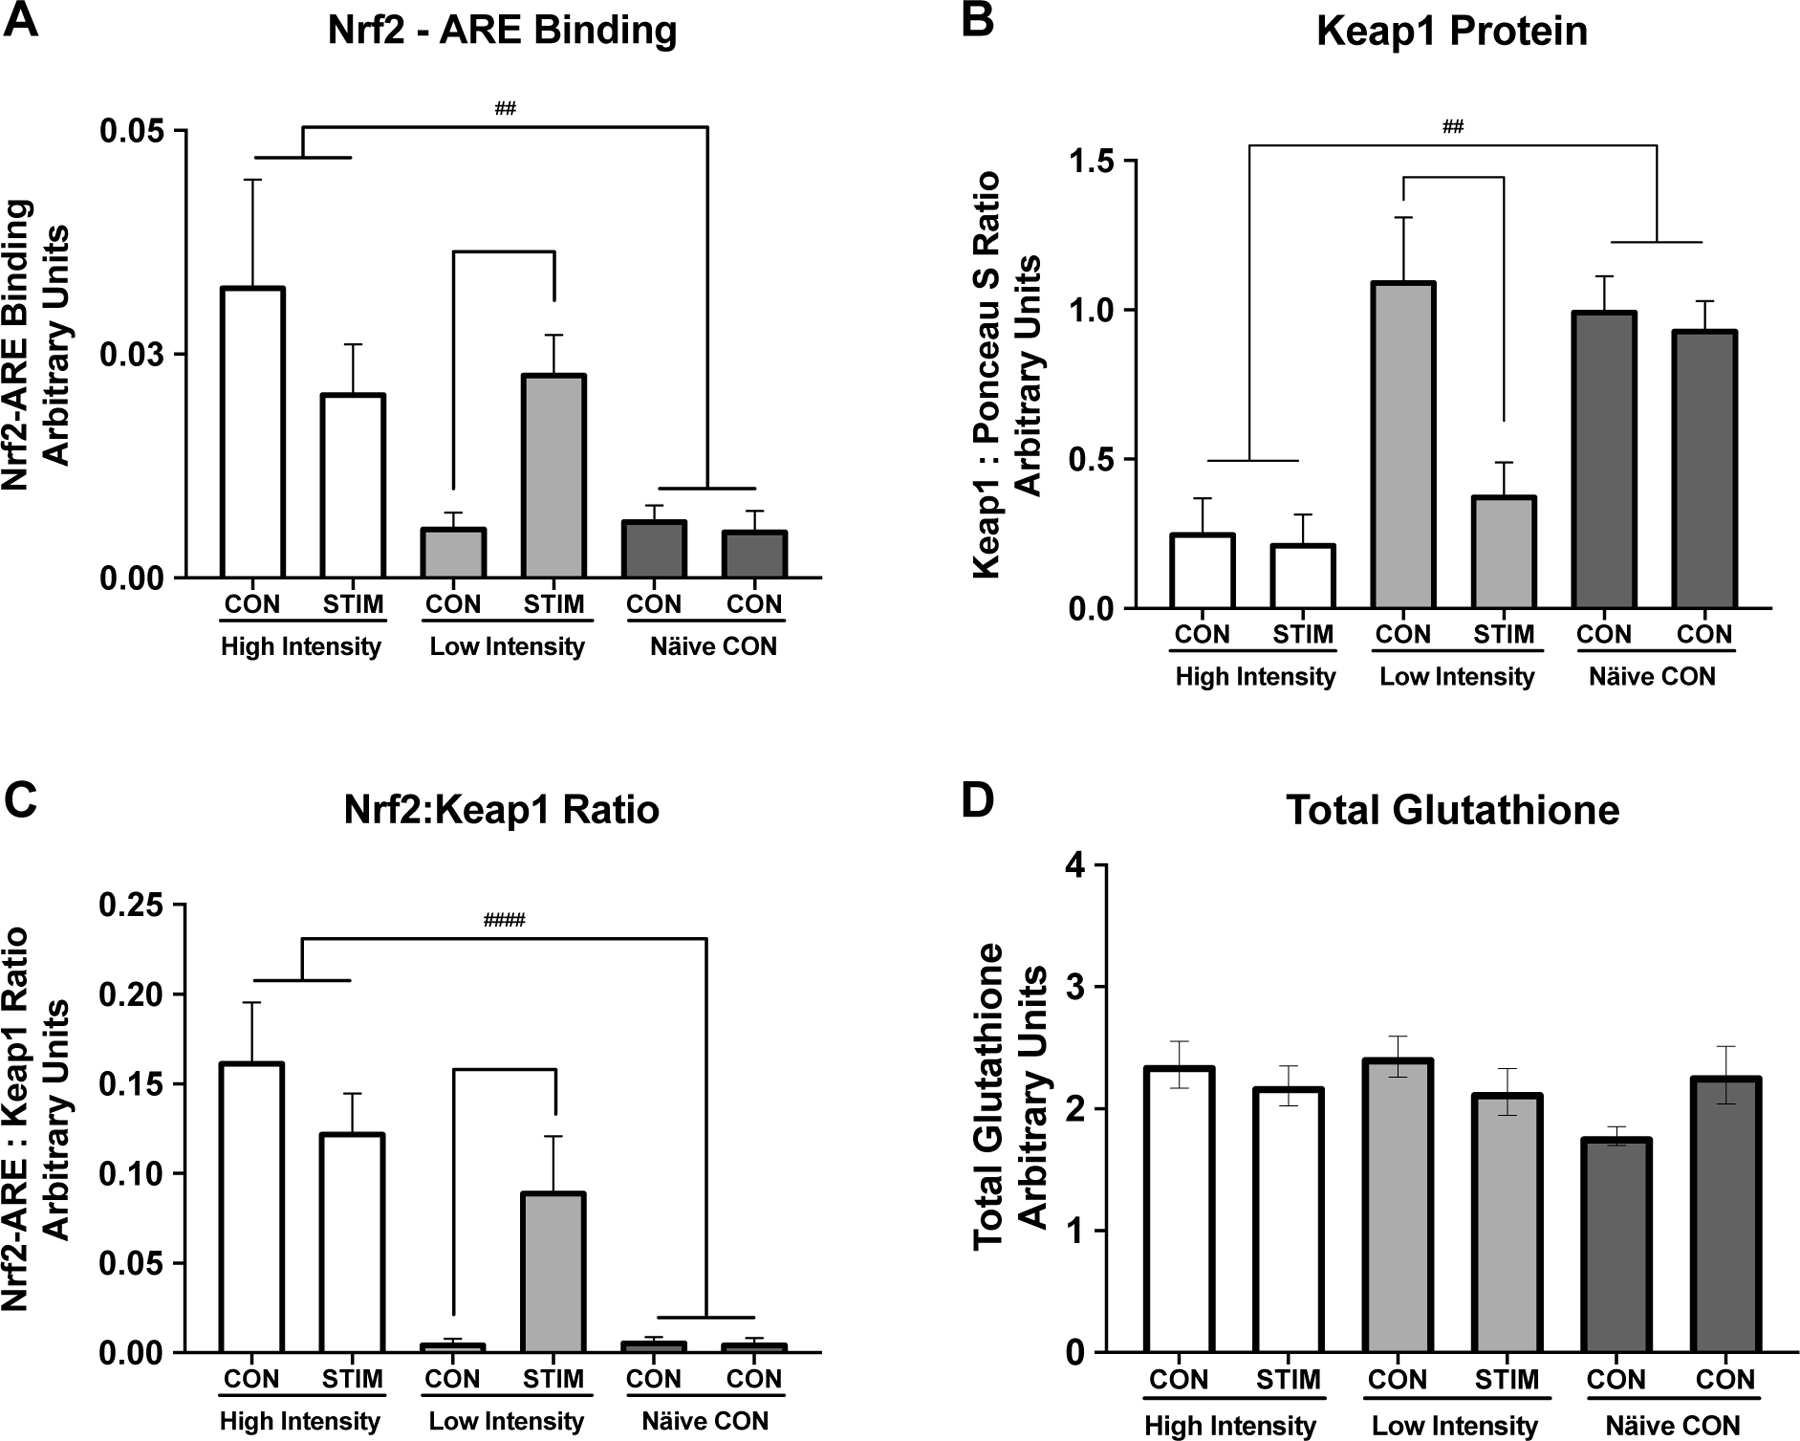
Figure 3. Nrf2-ARE Binding and Keap1 Protein Expression in Response to Skeletal Muscle Stimulation.

Keap1-Nrf2-ARE signaling response to high and low intensity stimulation and total glutathione content. A) Nrf2-ARE binding was low under basal unstimulated conditions (Naïve Control group and LI CON condition) but increased in response to low intensity stimulation (LI-CON vs LI-STIM, * p = 0.047). Nrf2-ARE binding was significantly higher in the HI group compared to NC group (## p = 0.007) . B) Keap1 content was unchanged between limbs in the Naïve Control group or the LI-CON, however there was a significant decrease in Keap1 content in the LI-STIM limb (*p = 0.015). Keap1 content was significantly lower in the HI group under both conditions compared to NC (##p = 0.008). C) Nrf2 :Keap1 ratio illustrates the same pattern as either Nrf2-ARE binding or Keap1 protein content alone (HI vs NC, #### p < 0.0001). D) Total glutathione content, measured in gastrocnemius muscle, was not different across groups and did not change significantly in response to stimulation. Representative western blot image of Keap1 protein is shown in Figure 5B. Keap1 was normalized to left hind limb of the NC group. Data are presented as mean ± SEM.
