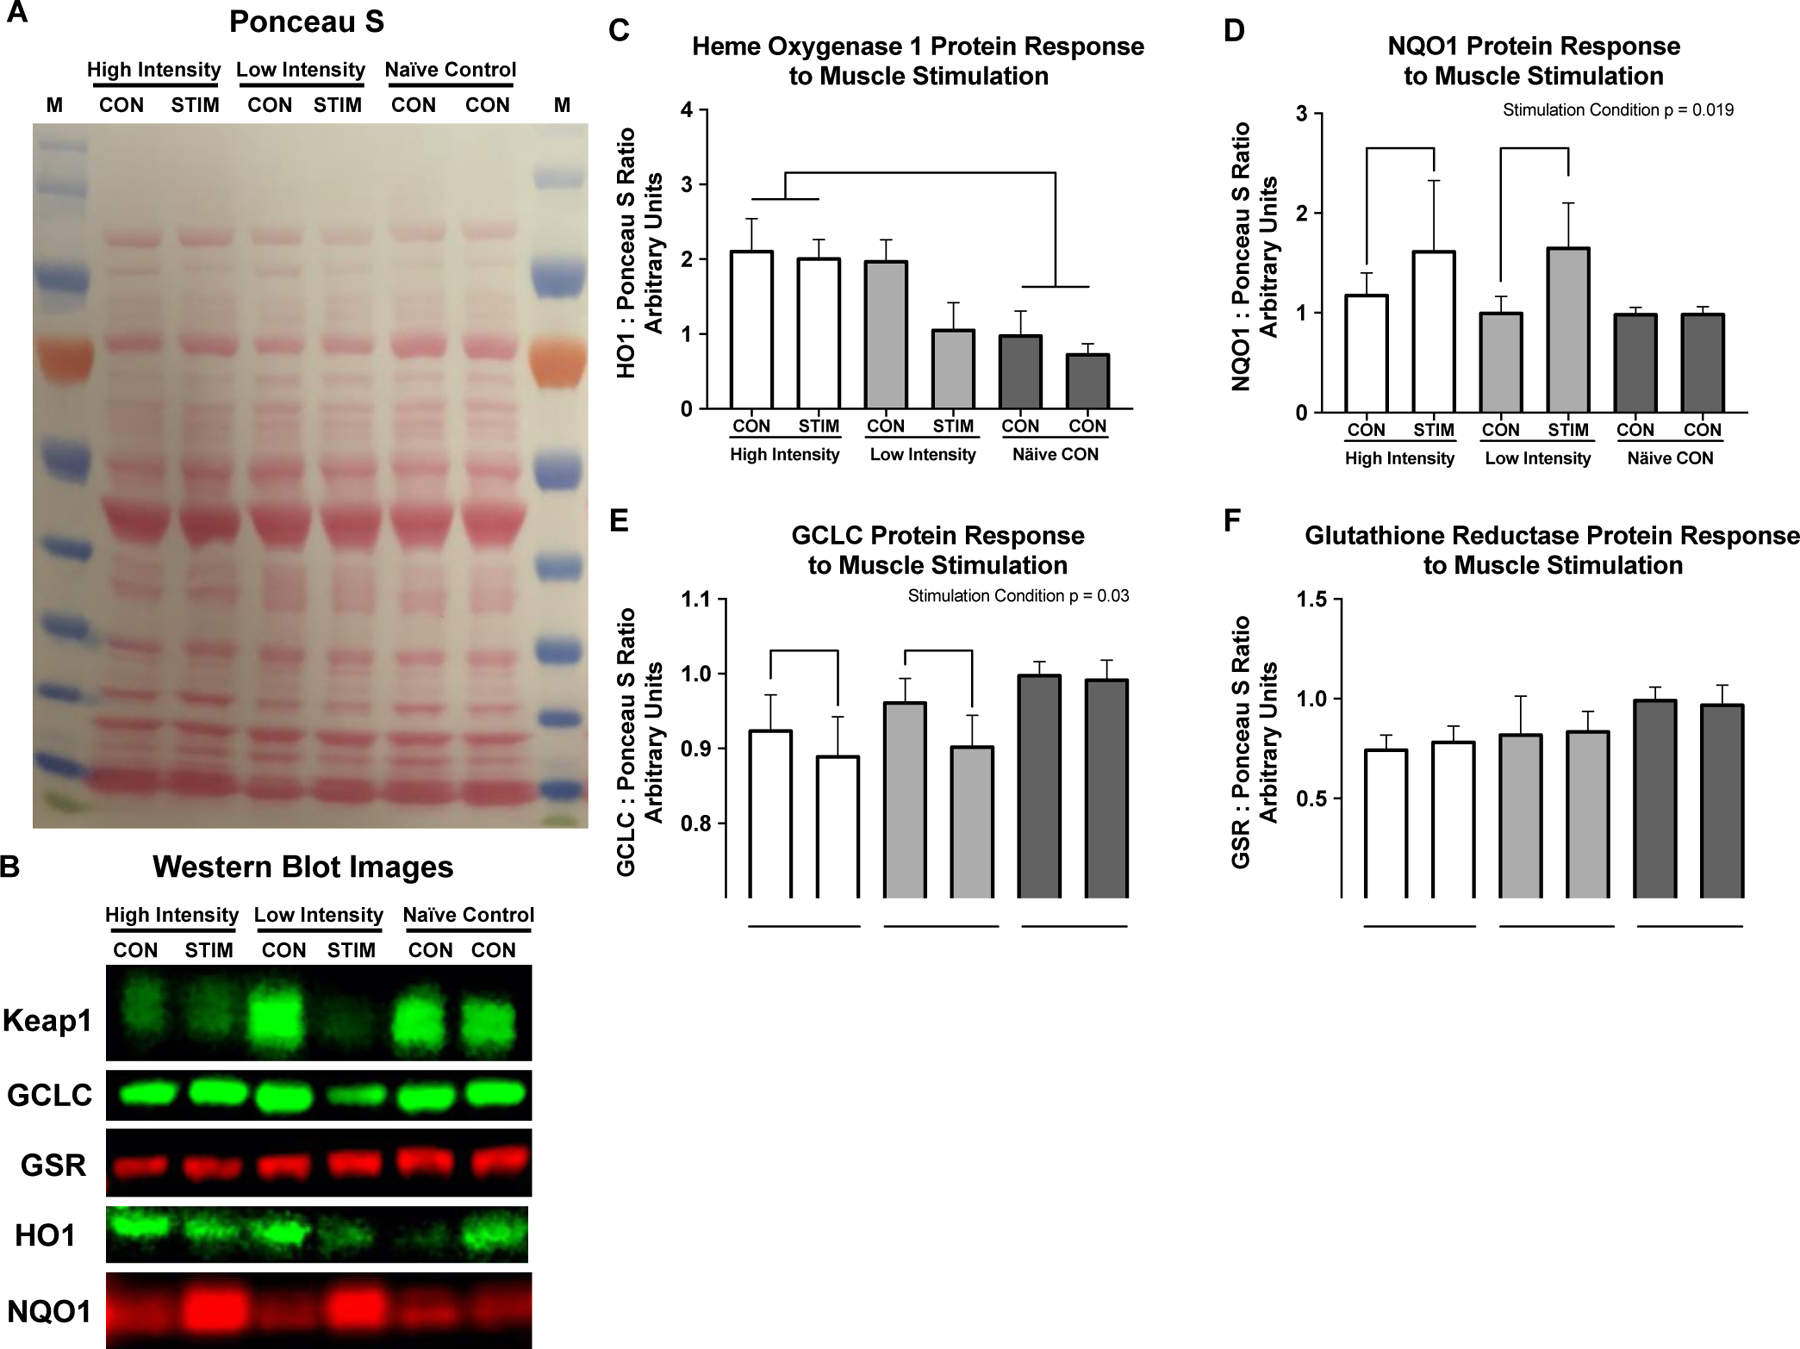
Fig. 5. Redox stress protein response to muscle stimulation.

Redox stress protein response to muscle stimulation. A) Representative Ponceau S stain, B) Representative western blot images. C) Heme Oxygenase 1 protein is significantly elevated in both conditions of the high intensity group compared to the Naïve control group (p = 0.002). D) NQO1 protein increased significantly in response to stimulation (Stimulation condition p = 0.019), with no differences between intensities, or across groups. E) GCLC decreased slightly in stimulation conditions regardless of intensity (Stimulation condition p = 0.03) with no differences between groups. Glutathione reductase was unchanged in response to muscle stimulation or across intensity groups. All values are normalized to left limb of the NC group and set equal to 1 for western blot graphs.
