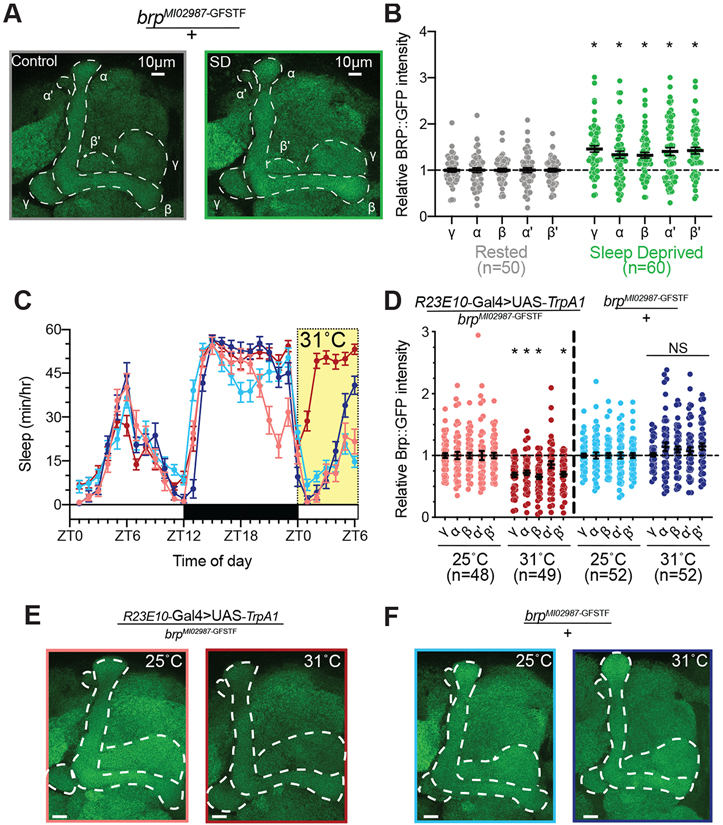
Figure 1 – Sleep bidirectionally regulates Brp abundance in the mushroom body.
(A) Representative images of endogenous Brp (green) labeled with GFP in brpMI02987-GFSTF/+ flies following 12 hours of rest (left) or 12 hours of overnight sleep deprivation (right). The lobes of the MB are outlined in white.
(B) Quantification of Brp::GFP intensity throughout the MB lobes of brpMI02987-GFSTF/+ flies after 12-hr of overnight sleep loss (green) normalized to rested controls (gray). Two-way ANOVA finds a significant effect of SD (F(1,108)=20.62, p<0.0001, n=50-60 hemispheres/group). Pairwise comparisons using Sidak’s multiple comparisons test found significant increases in Brp::GFP in each MB lobe after sleep deprivation relative to rested siblings (p≤0.002 for each test).
(C) Hourly sleep traces at 25°C (light shading) and 31°C (dark shading) for R23E10-Gal4>UAS-TrpA1/brpMI02987-GFSTF (red) and brpMI02987-GFSTF/+ flies (blue). Thermogenetic activation of dFB neurons in brpMI02987-GFSTF -expressing flies (R23E10-Gal4>UAS-TrpA1/brpMI02987-GFSTF; dark red) increased sleep time compared to siblings that remained at 25°C (light red) and brpMI02987-GFSTF/+ genetic controls that were housed at 25°C (light blue) or shifted to 31°C (dark blue). Flies were temperature shifted from ZT0-6 (yellow shading).
(D) Quantification of Brp::GFP intensity for groups shown in Figure 1C. Sleep induction in R23E10-Gal4>UAS-TrpA1/brpMI02987-GFSTF flies that were shifted to 31°C (dark red) led to a significant decrease in Brp intensity in α, β, β’, and γ lobes compared to siblings that remained at 25°C (light red). Exposure to 31°C did not change Brp::GFP in brpMI02987-GFSTF/+ genetic controls (25°C shown in light blue, 31°C in dark blue). Two-way Repeated Measures ANOVA found a significant group-by-lobe interaction (F(12,784)=3.796, p<0.0001, n=48-52 hemispheres/group).
(E) Representative images of endogenous Brp::GFP labeled in R23E10-Gal4>UAS-TrpA1/brpMI02987-GFSTF flies that were housed at 25°C (left) or given a 6-h exposure at 31°C (right).
(F) Representative images of endogenous Brp::GFP labeled in brpMI02987-GFSTF/+ flies that were housed at 25°C (left) or shifted to 31°C for 6-h (right).
See also Figure S1 for sleep traces from experimental groups shown in Figure 1A-B.
Scale bars depict 10 μm; error bars represent SEM for all panels.

