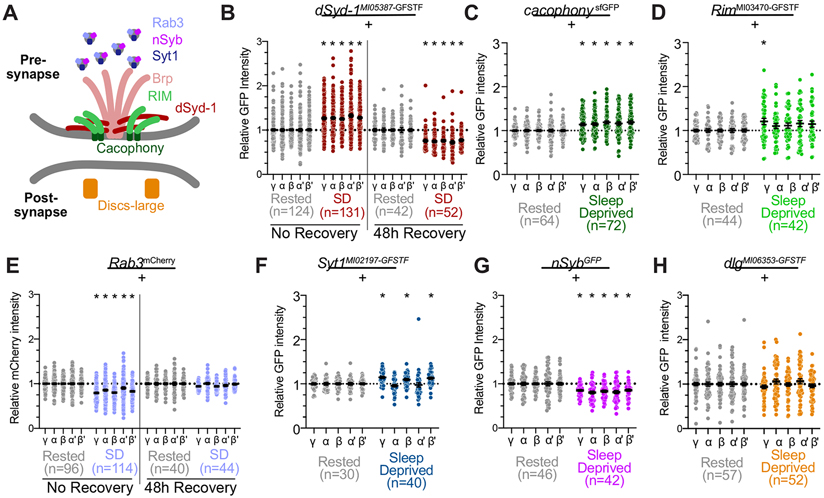
Figure 2 – Pre-synaptic proteins show variable responses to sleep loss in the MB lobes.
(A) Schematic illustration of pre-synaptic active zone, including core protein components observed in these studies. Brp localizes in the electron-dense T-bar, where it physically interacts with Syd-1. Both contribute to the recruitment of other pre-synaptic proteins to the AZ. RIM is necessary for proper localization of the Ca2+ channel Cacophony in the pre-synaptic plasma membrane. Rab3 regulates priming of vesicles and organization of AZ proteins. Syt-1 is a Ca2+ sensor located on synaptic vesicles. Nsyb is localized to synaptic vesicles and mediates vesicle fusion. Dlg is a scaffolding protein that is primarily located at the postsynaptic density.
(B) Abundance of dSyd-1::GFP throughout the MB after overnight sleep deprivation (red) compared to rested controls (grey) when flies were dissected either immediately following sleep deprivation (left) or allowed 48h of ad libitum recovery sleep before dissection (right); dSyd-1::GFP intensity in all groups is normalized to rested controls. Two-way ANOVA finds a significant effect of SD (F(3,345)=43.12, p<0.0001, n=42-131 hemispheres/group).
(C) Quantification of Cac::sfGFP intensity in MB axonal lobes following overnight sleep deprivation (green) normalized to rested controls (grey). Two-way ANOVA finds a significant effect of SD (F(1,134)=18.51, p<0.0001, n=64-72 hemispheres/group).
(D) Quantification of Rim::GFP in the MB lobes of sleep deprived RimMI03470-GFSTF flies (green) and rested controls (grey). Two-way ANOVA finds a significant effect of SD (F(1,84)=4.871, p=0.03, n=42-44 hemispheres/group), post-hoc comparisons using Sidak’s multiple comparisons test finds a significant increase in Rim::GFP abundance in the γ lobes (p=0.048), but not in α (p=0.54), β (p=0.38), α’ (p=0.23), or β’ (p=0.27).
(E) Fluorescent intensity of endogenous Rab3::mCherry in the MB lobes of sleep deprived Rab3mCherry/+ (light blue) compared to rested siblings (grey). Data from brains dissected immediately following sleep-deprivation shown on left; right depicts quantification of brains dissected after 48h of recovery from overnight sleep deprivation. Two-way ANOVA finds a significant lobe x group interaction (F(12,1160)=4.472, p<0.0001, n=42-131 hemispheres/group).
(F) Quantification of Syt1::GFP intensity throughout the MB after overnight sleep deprivation (dark blue) compared to rested controls (grey). Two-way ANOVA finds a significant lobe-by-SD interaction (F(4,272)=7.94, p<0.0001, n=30-40 hemipsheres/group); post-hoc comparisons using Sidak’s multiple comparisons test find a significant increase of Syt1::GFP in the γ (p=0.0005), β (p=0.029), and β’ lobes (p=0.0023). No significant change was detected in the α or α’ lobes (p=0.7827 and 0.9937, respectively, by Sidak’s multiple comparisons tests).
(G) Abundance of nSyb::GFP in MB lobes of rested (grey) and sleep-deprived flies (magenta). Two-way repeated measures ANOVA finds a significant effect of sleep deprivation on nSyb::GFP abundance (F(1,86)=19.33, p<0.0001, n=42-46 hemispheres/group).
(H) Dlg::GFP levels in the MB lobes of rested controls (grey) and sleep-deprived siblings (orange). Two-way repeated measures ANOVA finds no significant effect of sleep deprivation (F(1,107)=0.002567, p=0.9597, n=52-57 hemispheres/group).
See also Figure S1 for representative images and sleep traces from each experimental group and genotype.
Scale bars depict 10 μm; error bars represent SEM for all panels.

