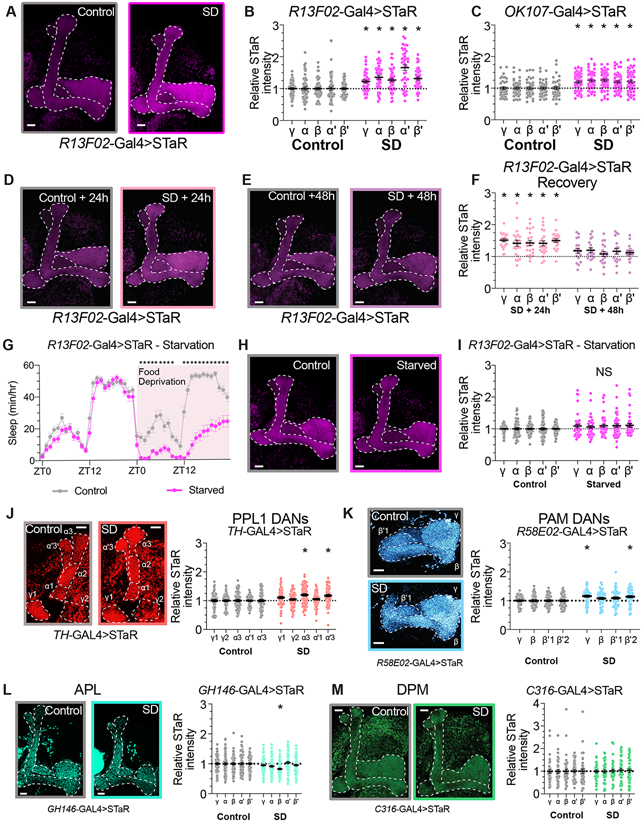
Figure 3 – Increased BRP abundance in Kenyon cell axons after sleep deprivation.
(A) Representative images from R13F02-Gal4>STaR flies after 12 hours of rest (left) or 12 hours of overnight SD (right). Presynapses labelled by STaR (BRP::V5) in magenta.
(B) Quantification of BRP::V5 intensity in rested controls (gray) and after overnight SD (magenta) in KCs labeled by R13F02-Gal4. Two-way ANOVA finds a significant effect of SD (F(1,94)=43.43, p<0.0001, n=42-54 hemispheres/group).
(C) Quantification of BRP::V5 intensity in rested controls (gray) and after overnight SD (magenta) in KCs labeled by OK107-Gal4. Two-way ANOVA finds a significant effect of SD (F(1,94)=19.82, p<0.0001, n=42-54 hemispheres/group).
(D-E) Representative images from R13F02-Gal4>STaR flies following 24- (D) or 48-hours (E) of recovery sleep from overnight SD.
(F) BRP::smFP_V5 intensity quantification for R13F02-Gal4>STaR flies permitted 24- or 48-hours of ad lib recovery sleep following overnight sleep deprivation. Fluorescence intensity is normalized to time-matched rested controls for each SD group. Two-way ANOVA finds a significant effect of group (F(3,82)=21.11, p<0.0001, n=18-24 hemispheres/group). * represents p<0.05 by Sidak’s pairwise comparisons test for SD vs control at the matched timepoint.
(G) Hourly sleep timecourse from R13F02-Gal4>STaR flies that were provided 24h of baseline sleep before either control handling (grey) or food deprivation (magenta). Two-way Repeated Measures ANOVA finds a significant time-by-treatment interaction (F(47,3760)=20.51, p<0.0001, n=39-43 flies/group).
(H) Representative images from R13F02-Gal4>STaR flies after control handling (left) or 24h of food deprivation (right).
(I) Quantification of BRP::smFP_V5 abundance in MB lobes of R13F02-Gal4>STaR flies that have been fed standard fly media (grey) or starved for 24h (magenta). Two-way repeated measures ANOVA finds no significant effect of starvation (F(1,92)=3.229, p=0.0756, n=41-53 hemispheres/group).
(J) Left panel depicts representative images from TH-Gal4>STaR flies after 12 hours of rest (left) or 12 hours of overnight SD (right). Presynapses labelled by STaR (BRP::V5) in red. Right panel shows quantification of BRP::smFP_V5 intensity in rested controls (gray) and after overnight SD (red) in PPL1 dopaminergic neurons labeled by TH-Gal4. Two-way ANOVA finds a significant sleep by MB compartment (F(4,556)=6.184, p<0.0001, n=69-72 hemispheres/group).
(K) Left panel: representative images from R58E02-Gal4>STaR flies labeling BRP in PAM dopaminergic neurons after 12 hours of rest (left) or 12 hours of overnight SD (right). Presynapses labelled by STaR (BRP::V5) in blue. On right, quantification of BRP::smFP_V5 intensity in rested controls (gray) and after overnight SD (blue) in PAM DANs labeled by R58E02-Gal4. Two-way ANOVA finds a significant effect of SD (F(1,104)=7.893, p=0.0059, n=50-56 hemispheres/group).
(L) Left, Representative images from GH146-Gal4>STaR flies after 12 hours of rest (left) or 12 hours of overnight SD (right). Presynapses labelled by STaR (BRP::V5) in green. Right panel shows quantification of BRP::smFP_V5 intensity in rested controls (gray) and after overnight SD (green) in APL labeled by GH146-Gal4. Two-way ANOVA finds a significant lobe by sleep interaction (F(4,480) = 6.672, p<0.0001, n=60-62 hemispheres/group).
(M) On left, representative images from C316-Gal4>STaR flies after 12 hours of rest (left) or 12 hours of overnight SD (right). Presynapses labelled by STaR (BRP::smFP_V5) in green. Right panel depicts quantification of BRP::V5 intensity in rested controls (gray) and after overnight SD (green) in DPM labeled by C316-Gal4. Two-way ANOVA finds no significant effect of SD (F(1,79)=0.04082, p=0.84, n=40-41 hemispheres/group).
See also Figure S2 for sleep traces from experimental groups shown in Figure 3 A-J, and Figure S3 for pre-synaptic BRP quantification from subsets of KC neurons.
Scale bars depict 10 μm; error bars represent SEM for all panels.

