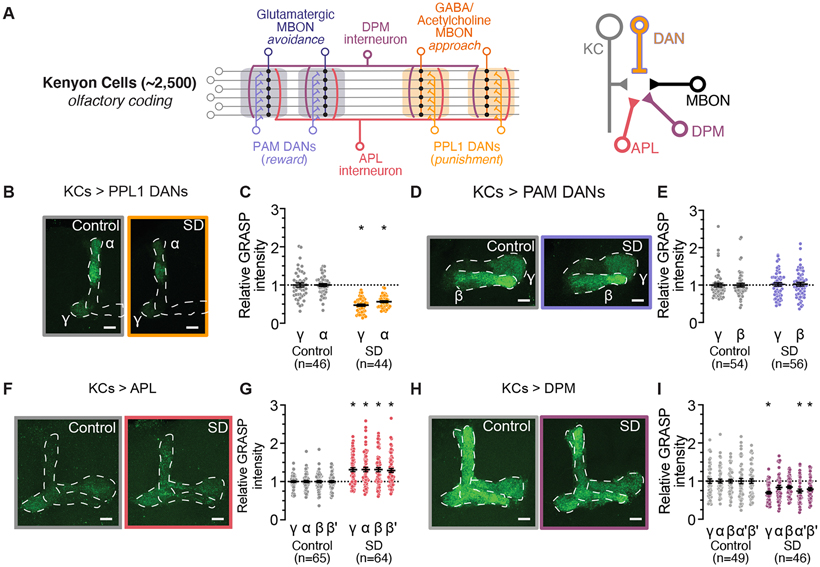
Figure 4 – Effects of SD on synaptic contacts between KCs and DANs, APL & DPM.
(A) Schematic of connectivity between neuronal cell types in the MB. KC axons innervate tiled zones (depicted by shaded regions) that each receive innervation from distinct DANs and provide input to unique MBONs. APL and DPM interneurons receive input from and provide recurrent feedback to KC pre-synapses (Left). KC pre-synapses project onto MBON, DAN, APL, and DPM partners (Right).
(B) Representative images of nsyb GRASP intensity between presynaptic KCs (MB-LexA) and postsynaptic PPL1 DANS (TH-Gal4) in rested controls (left) and in flies subjected to overnight SD (right).
(C) Quantification of relative KC>PPL1 GRASP intensity after SD (orange) normalized to rested controls (gray). Two-way ANOVA finds a significant effect of SD (F(1,88)=91.81, p<0.0001, n=44-46 hemispheres/group).
(D) Representative images of nsyb GRASP intensity between presynaptic KCs (MB-LexA) and postsynaptic PAM DANs (R58E02-Gal4) in rested controls (left) and in flies subjected to overnight SD (right).
(E) Quantification of relative KC>PAM GRASP intensity in γ and β lobes after SD (purple), normalized to rested controls (gray). Two-way ANOVA finds no significant effect of SD (F(1,108)=0.09979, p=0.7527, n=54-56 hemispheres/group).
(F) Representative images of nsyb GRASP intensity between presynaptic KCs (MB-LexA) and postsynaptic APL (GH146-Gal4) in the MB lobes of rested controls (left) and in flies subjected to overnight SD (right).
(G) Quantification of relative KC>APL GRASP intensity after SD (red), normalized to rested controls (gray). Two-way ANOVA finds a significant effect of SD (F(1,127)=30.17, p<0.0001, n=64-65 hemispheres/group)
(H) Representative images of nsyb GRASP intensity between presynaptic KCs (MB-LexA) and postsynaptic DPM (C316-Gal4) in rested controls (left) and in flies subjected to overnight SD (right).
(I) Quantification of relative KC>DPM GRASP intensity after SD (magenta), normalized to rested controls (gray). Two-way ANOVA finds a significant effect of SD (F(1,93)=11.42, p=0.0011, n=46-49 hemispheres/group)
See also Figure S4 for sleep traces from experimental groups shown in Figure 3 B-I.
Scale bars depict 10 μm; error bars represent SEM for all panels.

