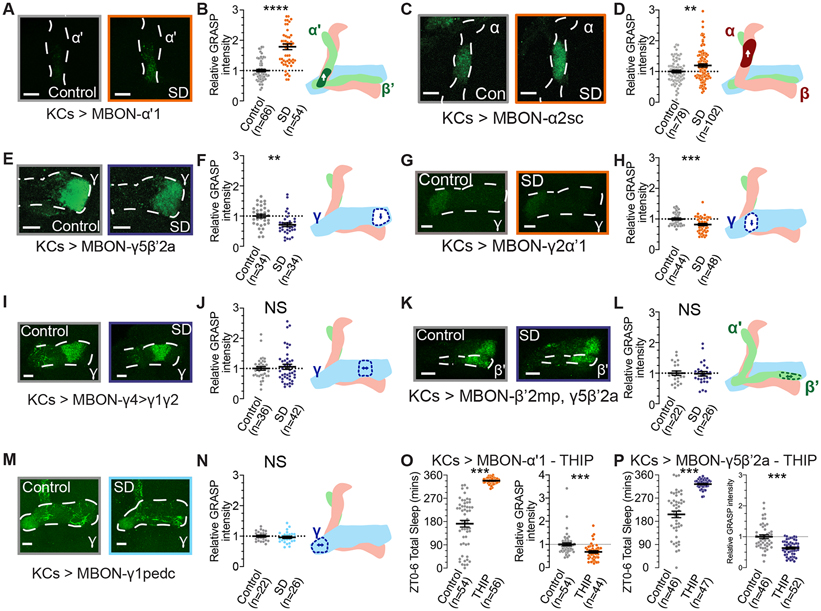
Figure 5 – KC>MBON connections exhibit compartment-specific changes with SD.
(A) Representative images of nsyb GRASP intensity between presynaptic KCs (MB-LexA) and postsynaptic MBON-α’1 (MB543B-Gal4) in rested controls (left) and in flies subjected to overnight SD (right).
(B) Quantification of relative KC>MBON-α’1 GRASP intensity after SD (orange), normalized to rested controls (gray). Two-tailed T-test finds a significant effect of SD (t=8.068, p<0.0001, n=54-66 hemispheres/group).
(C) Representative images of nsyb GRASP intensity between presynaptic KCs (MB-LexA) and postsynaptic MBON-α2sc (R71D08-Gal4) in rested controls (left) and in flies subjected to overnight SD (right).
(D) Quantification of relative KC>MBON-α2sc GRASP intensity after SD (orange), normalized to rested controls (gray). Two-tailed T-test finds a significant effect of SD (t=2.800, p=0.0057, n=78-102 hemispheres/group).
(E) Representative images of nsyb GRASP intensity in the γ5 compartment between presynaptic KCs (MB-LexA) and postsynaptic MBON-γ5β’2a (R66C08-Gal4) in rested controls (left) and in flies subjected to overnight SD (right).
(F) Quantification of relative KC>MBON-γ5β’2a GRASP intensity in the γ5 compartment after SD (blue), normalized to rested controls (gray). Two-tailed T-test finds a significant effect of SD (t=3.411, p=0.0011, n=34 hemispheres/group).
(G) Representative images of nsyb GRASP intensity in the γ2 compartment between presynaptic KCs (MB-LexA) and postsynaptic MBON-γ2α’1 (R25D01-Gal4) in rested controls (left) and in flies subjected to overnight SD (right).
(H) Quantification of relative KC>MBON-γ2α’1 GRASP intensity in the γ2 compartment after SD (orange), normalized to rested controls (gray). Two-tailed T-test finds a significant effect of SD (t=3.793, p=0.0003, n=44-48 hemispheres/group).
(I) Representative images of nsyb GRASP intensity in the γ4 compartment between presynaptic KCs (MB-LexA) and postsynaptic MBON-γ4>γ1γ2 (MB434B-Gal4) in rested controls (left) and in flies subjected to overnight SD (right).
(J) Quantification of relative KC>MBON-γ4>γ1γ2 GRASP intensity in the γ4 compartment after SD (blue), normalized to rested controls (gray). Two-tailed T-test finds no significant effect of SD (t=0.5245, p=0.6015, n=36-42 hemispheres/group).
(K) Representative images of nsyb GRASP intensity in the β’2 compartment between presynaptic KCs (MB-LexA) and postsynaptic MBON-β’2mp, γ5β’2a (MB011B-Gal4) in rested controls (left) and in flies subjected to overnight SD (right).
(L) Quantification of relative KC>MBON-β’2mp, γ5β’2a GRASP intensity in the β’2 compartment after SD (blue), normalized to rested controls (gray). Two-tailed T-test finds no significant effect of SD (t=0.1928, p=0.8480, n=22-26 hemispheres/group).
(M) Representative images of GRASP labelling from presynaptic KCs (MB-LexA) and postsynaptic MBON-γ1pedc (R12G04-Gal4) in rested controls (left) and flies dissected after overnight sleep loss (right).
(N) Relative quantification of KC>MBON-γ1pedc GRASP intensity in the γ1 compartments of rested (gray) and sleep deprived (light blue) brains. Two-tailed T-test finds no significant effect of SD (t=0.7659, p=0.4476, n=22-26 hemispheres/group).
(O) Left; sleep totals for KC>MBON-α’1 GRASP flies either fed standard fly media (gray) or 0.1 mg/mL THIP (orange). Right; Relative KC>MBON-α’1 GRASP intensity for groups shown in left panel (gray depicts vehicle controls, orange shows 6h treatment with 0.1mg/mL THIP). Two-tailed T-tests find significant effects of THIP treatment on sleep (t=12.95, p<0.0001, n=54-56) and GRASP abundance (t=3.906, p=0.0002, n=44-54 hemispheres/group).
(P) Left; 6h sleep amount for control (gray) and THIP-treated (blue; 0.1mg/mL THIP) KC>MBON-γ5β’2a GRASP flies. Right; Relative intensity of KC>MBON-γ5β’2a GRASP signal in control flies (gray) and flies fed THIP for 6h prior to dissection. Two-tailed T-test finds a significant effect of THIP treatment on sleep (t=10.14, p<0.0001, n=44-47) and on KC>MBON-γ5β’2a GRASP intensity (t=5.492, p<0.0001, n=46-52).
See also Figure S5 for sleep traces from experimental groups in Figure A-L.
Scale bars depict 10 μm; error bars represent SEM for all panels.

