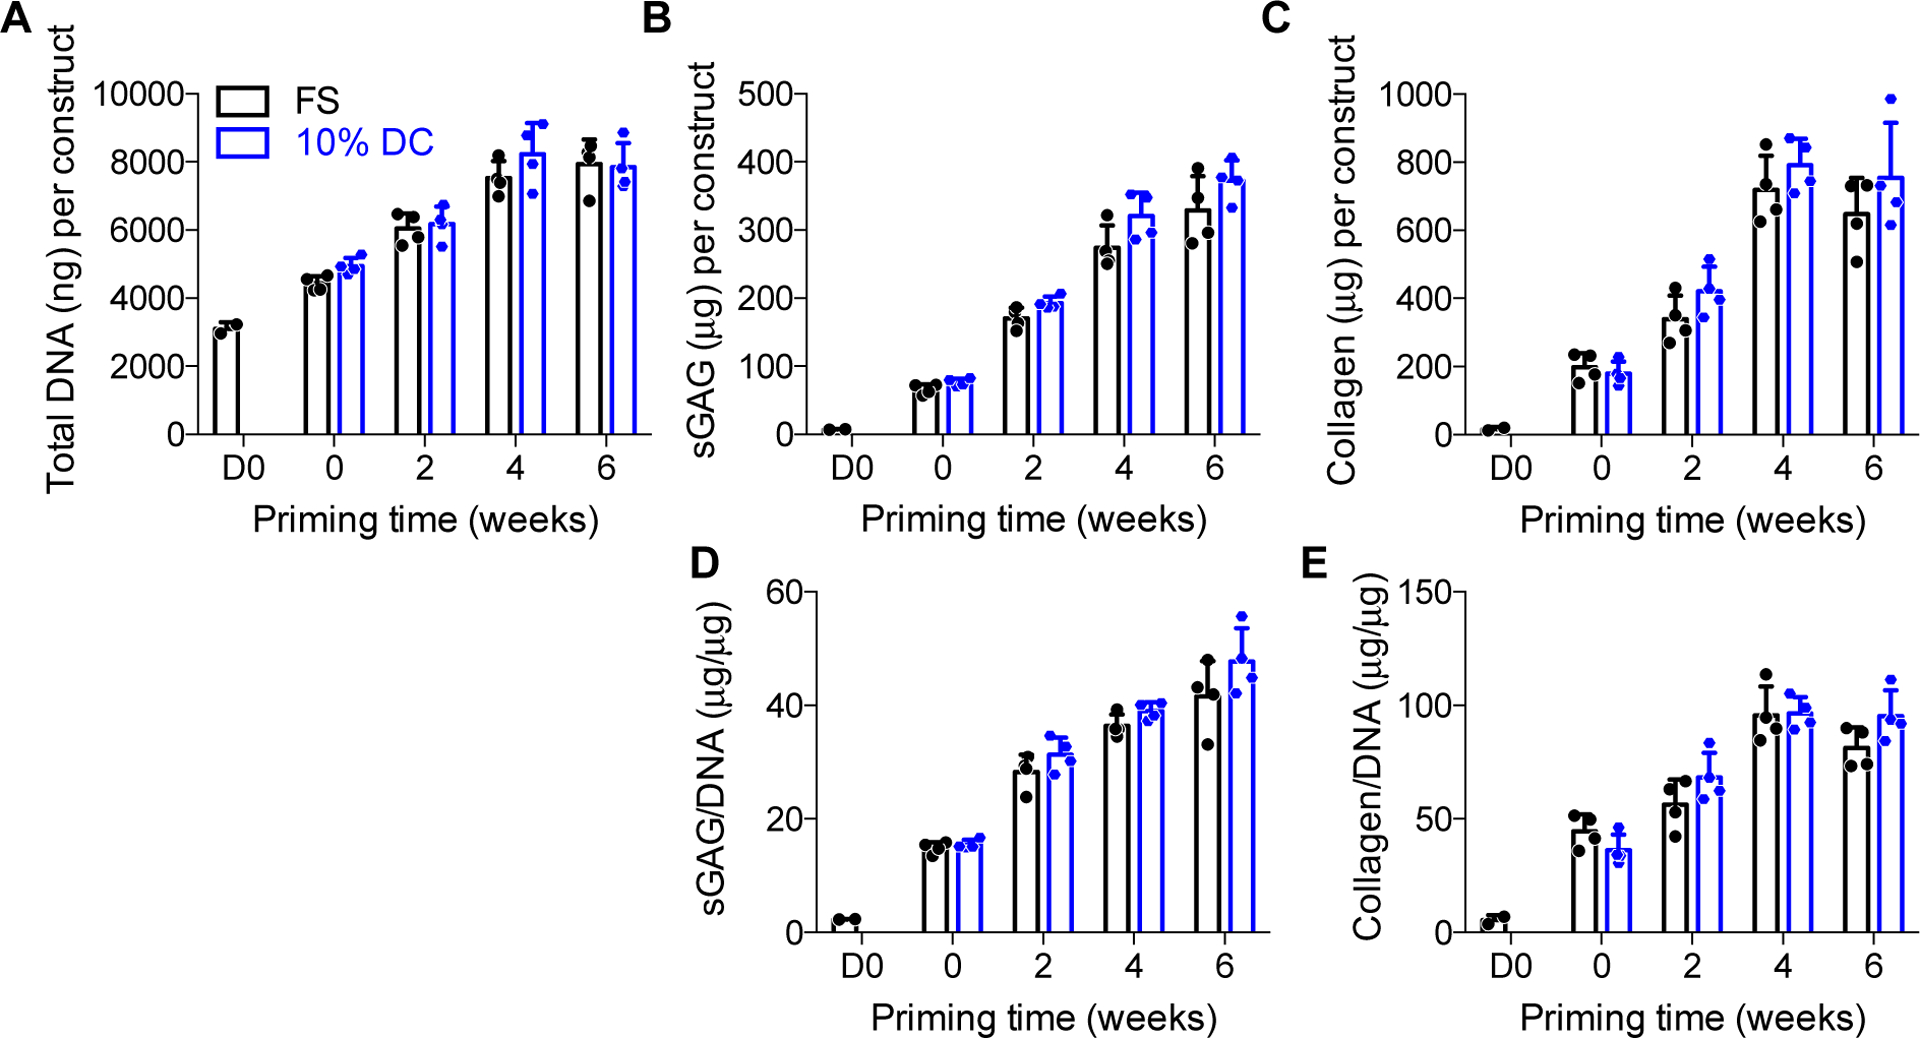
Figure 3: Biochemical content of chondrogenically-primed hMSC constructs under free-swelling (FS) or 10% dynamic compression (DC) conditions.

Samples were digested and assayed for biochemical content at the end of the final loading cycle for each group, in comparison to time-matched free-swelling controls. Each construct was assayed for total DNA content (A), total sulfated glycosaminoglycans (sGAG) (B), and total collagen (C). sGAG (D) and collagen (E) were then normalized, on a per-sample basis, to DNA content. Data are displayed as mean ± s.d. with individual data points. Differences between groups and time points were evaluated by two-way ANOVA followed by Sidak’s multiple comparison test. The significance threshold was set at α=0.05. All measures increased significantly with time. ANOVA analysis indicated a significant effect of time for sGAG and sGAG/DNA, but there were no differences for individual comparisons between FS and DC at any time point. N = 3 – 4 per group.
