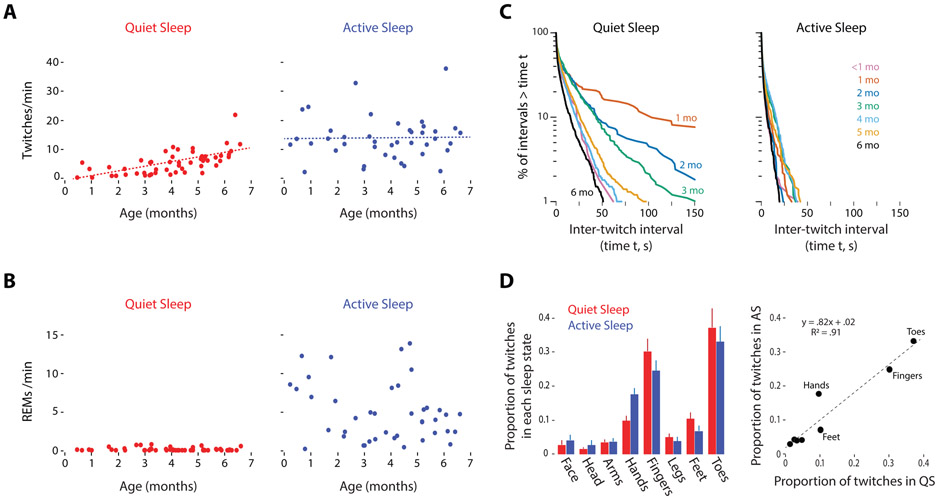
Figure 2. Temporal organization of QS- and AS-related twitching over development.
(A) Scatterplots showing the rate of twitching during QS (red) and AS (blue) for each sleep session. The dotted lines show the model-predicted estimates for population means of twitch rate by age and sleep state. (B) Scatterplots showing the rate of rapid eye movements (REMs) during QS (red) and AS (blue) for each sleep session (C) Log-survivor plots of inter-twitch intervals (ITIs) during periods of QS and AS within each age group (see Figure S1B for sample sizes for each plot). ITIs were pooled across sleep sessions within each month of age. (D) Distribution of QS- and AS-related twitches across the body in 5-month-old infants. Left: For QS (red) and AS (blue), the mean (±se) proportions of twitches that occurred in the face, head, arms (shoulders/elbows), hands, fingers, legs (hips/knees), feet, and toes are shown. Data are from eight sleep sessions in which infants exhibited twitching during bouts of both QS and AS. Right: Scatterplot showing the proportion of twitches in QS and AS for each body segment for the data in the left panel. The best-fit line, regression equation, and R2 value are also shown. See also Table S1 and Figures S1 and S4.

