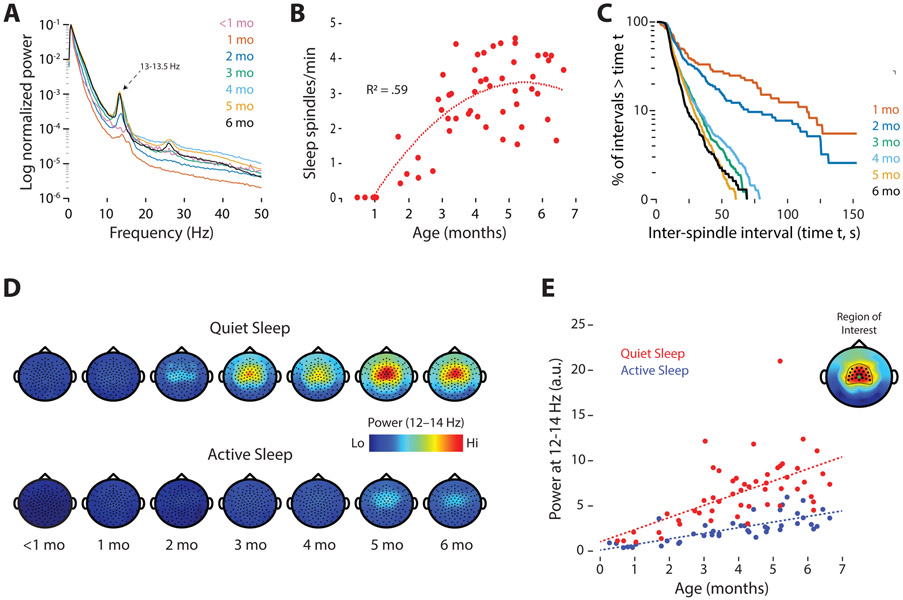
Figure 3. Increase in the rate and power of sleep spindles over development.
(A) Power spectra at representative electrode sites in centro-parietal cortex (C3 or C4), averaged across sleep sessions at each age. Note the frequency peaks at 13-13.5 Hz, particularly at 2-6 months of age. (B) Scatterplot showing the rate of sleep spindles during QS for each sleep session. Best-fit polynomial line and R2 value is shown. (C) Log-survivor plots of inter-spindle intervals during periods of QS in infants from 1 to 6 months of age. Intervals were pooled across all sleep sessions at each age (Ns = 72-1189 inter-spindle intervals). (D) Topoplots showing sleep spindle power (12-14 Hz) during QS and AS. Data averaged across sleep sessions at each age. (E) Power at sleep-spindle frequency (12-14 Hz; arbitrary units) averaged within a region of interest (inset; Cz electrode indicated by a green dot) during QS (red) and AS (blue) for each sleep session. The dotted lines show the model-predicted estimates for population means of spindle power by age and sleep state. See also Table S1 and Figures S2, S3, and S4.

