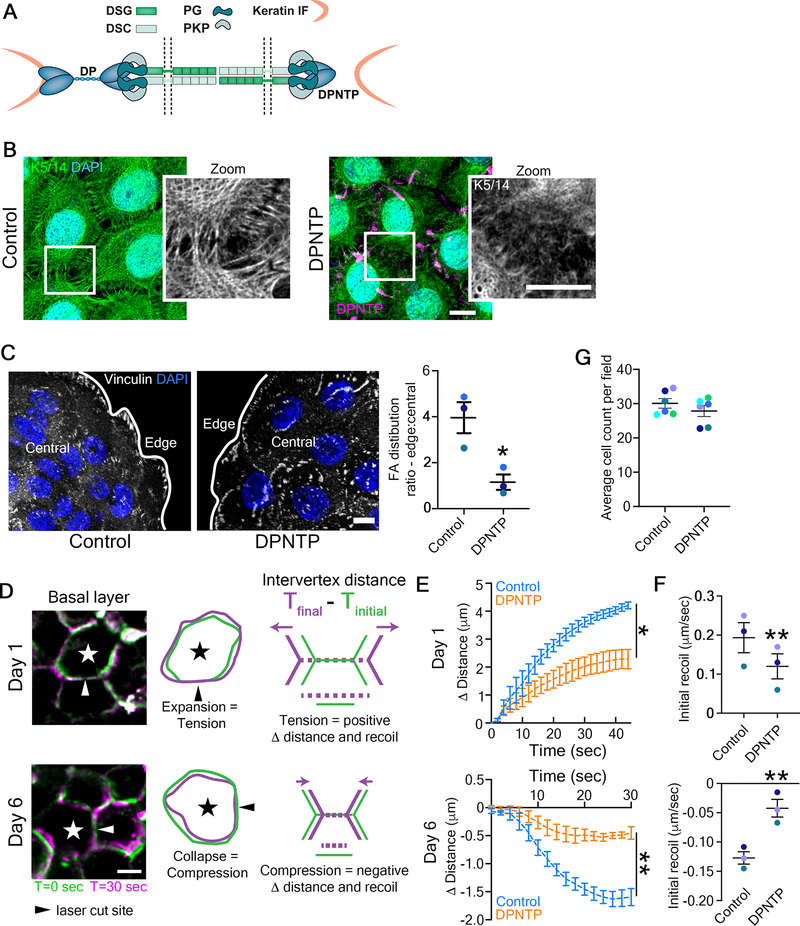
Figure 1. Uncoupling the desmosome/IF connection induces rearrangements of cytoskeletal/adhesive complexes.
A) Schematic depicts the interactions among the desmosomal core proteins and the intermediate filament (IF) cytoskeleton in both a control condition (left) as well as when the desmosomal core is uncoupled from IF (right). DP, desmoplakin; PKP, plakophilin; PG, plakoglobin; DSG, desmoglein; DSC, desmocollin.
B) Maximum projection micrographs show immunofluorescence staining of the keratin 5/14 (K5/14) IF cytoskeleton in basal cells of differentiating monolayers of NHEKs expressing either GFP (Control) or DPNTP-GFP. K5/14 is pseudocolored green and DPNTP is shown in magenta. DAPI indicates nuclei in blue and bar is 10 μm.
C) Left, maximum projection micrographs show immunofluorescence staining of vinculin at the basal/substrate interface of differentiating NHEK ephrin colonies expressing either GFP (Control) or DPNTP-GFP. DAPI indicates nuclei in blue and bar is 10 μm. Right, the average vinculin-positive area per cell was quantified for both cells on the edge and in the central region of the colony. The average ratio (dashed line) of edge to central cells is shown for control and DPNTP-expressing colonies. *p=0.0233, paired t-test from three independent experiments, error bars are SEM.
D) Images show the membranes (indicated by myr-tomato) of basal cells within epidermal equivalent cultures before and after laser ablation at the indicated times. At day 1, cells expand upon ablation, indicating tension within the layer and corresponding to a positive value for measured intervertex distance and initial recoil velocity. At day 6, cells collapse upon ablation, indicating compression within the layer and corresponding to a negative value for measured intervertex distance and initial recoil velocity. Bar is 5 μm. Related to Video S1.
E) Quantification is shown for the average change in intervertex distance (Δ Distance) over time for basal cells after ablation within control and DPNTP-expressing epidermal equivalent cultures both at day 1 and day 6 of their development. *p=0.0361, **p=0.0058, two-way ANOVA with repeated measures from three independent experiments, error bars are SEM.
F) Quantification is shown for the average initial recoil velocity after ablation for basal cells within control and DPNTP-expressing epidermal equivalent cultures both at day 1 (upper graph) and day 6 (lower graph) of their development. **p<0.009, paired t-test from three independent experiments, error bar is SEM.
G) The average cell count per field is shown for control and DPNTP-expressing epidermal equivalent cultures both at day 6 of their development. Dashed line is mean of 6 independent experiments, error bars are SEM.
See also Figure S1.

