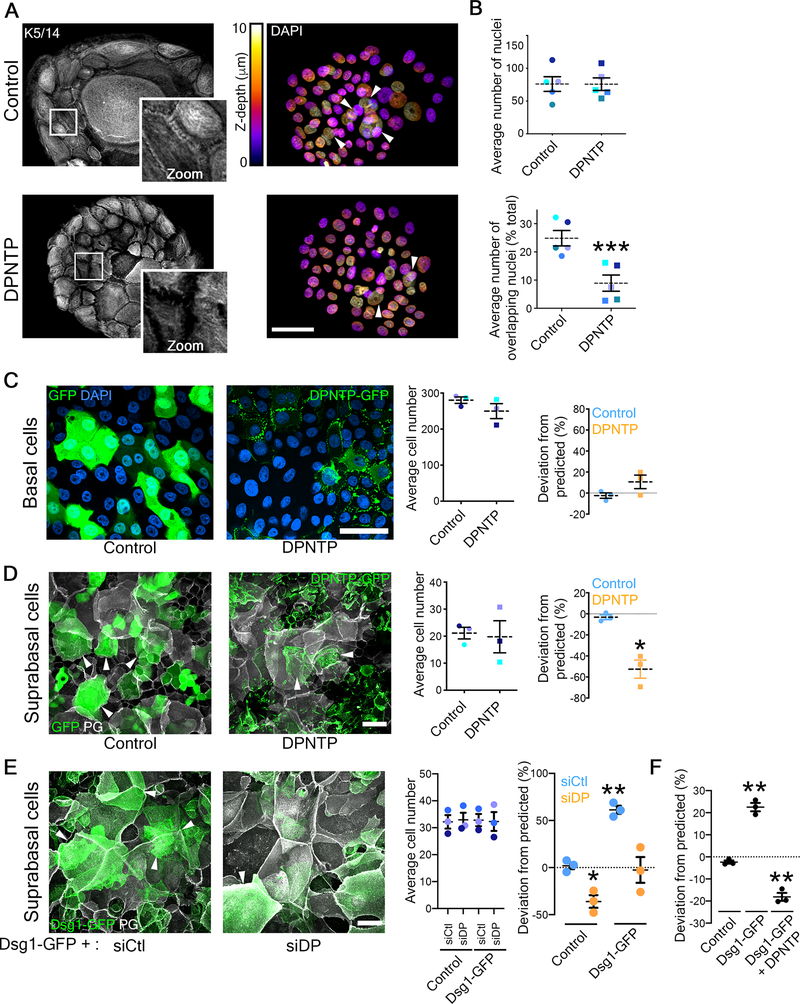
Figure 2. Uncoupling the desmosome/IF connection hinders epidermal keratinocyte stratification while promoting differentiation.
A) Maximum projection micrographs show immunostaining of keratin 5/14 (K5/14) intermediate filaments and nuclei stained with DAPI using the indicated look-up table that represents z-depth in control and DPNTP-expressing ephrin colonies. Zooms show retraction of keratin filaments from cell-cell interfaces upon uncoupling the desmosome/intermediate filament with DPNTP. Bar is 50 μm.
B) The average total number of DAPI-stained nuclei (as shown in A) per ephrin colony (top) and the average number of overlapping DAPI-stained nuclei (bottom) are shown for control and DPNTP-expressing ephrin colonies. Examples of overlapping nuclei are indicated with arrowheads in A. Dashed lines indicate the mean of 5 independent experiments and error bars are SEM. *p<0.0001, paired t-test.
C) Unlabeled wild type NHEKs were mixed at known ratios with NHEKs expressing either GFP as a control or DPNTP-GFP and cultured in 1.2 mM calcium medium for 3 days. Left, representative maximum projection micrographs of the basal layer of cultures are shown using DAPI shown in blue to label the total cell population. Bar is 50 μm. Middle, quantification of the average cell number per field from 3 independent experiments is shown. Right, quantification of the deviation from the predicted representation of GFP-positive cells in the basal layer is shown. Dashed lines indicate the mean of 3 independent experiments and error bars are SEM. See also Figure S2.
D) Unlabeled wild type NHEKs were mixed at known ratios with NHEKs expressing either GFP as a control or DPNTP-GFP and cultured in 1.2 mM calcium medium for 3 days. Left, representative maximum projection micrographs of the suprabasal layers of cultures are shown using plakoglobin (PG) to label the total cell population. Examples of GFP-positive suprabasal cells are indicated with arrowheads. Bar is 50 μm. Middle, quantification of the average cell number per field from 3 independent experiments is shown. Right, quantification of the deviation from the predicted representation of GFP-positive cells in the suprabasal layers is shown. Dashed lines indicate the mean of 3 independent experiments and error bars are SEM. *p=0.026, one sample t test with theoretical mean of 0. See also Figure S3.
E) Unlabeled wild type NHEKs were mixed at known ratios with NHEKs expressing Dsg1-GFP treated with siCtl or siDP and cultured in 1.2 mM calcium medium for 1 day. Left, representative maximum projection micrographs of the suprabasal layer of cultures are shown using plakoglobin (PG) to label the total cell population. Examples of Dsg1-GFP positive suprabasal cells are indicated with arrowheads. Bar is 50 μm. Middle, quantification of the average cell number per field from 3 independent experiments is shown. Right, quantification of the average deviation from the predicted representation of Dsg1-GFP positive cells treated with the indicated siRNA in the suprabasal layer is shown for 3 independent experiments and error bars are SEM. *p=0.038 and **p=0.005, one sample t test with theoretical mean of 0.
F) Unlabeled wild type NHEKs were mixed at known ratios with NHEKs expressing GFP (Control), Dsg1-GFP, and Dsg1-GFP co-expressing DPNTP-FLAG (DPNTP) and cultured in 1.2 mM calcium medium for 1 day. Quantification of the average deviation from the predicted representation in the suprabasal layer is shown for 3 independent experiments and error bars are SEM. **p≤0.001, one sample t test with theoretical mean of 0.

