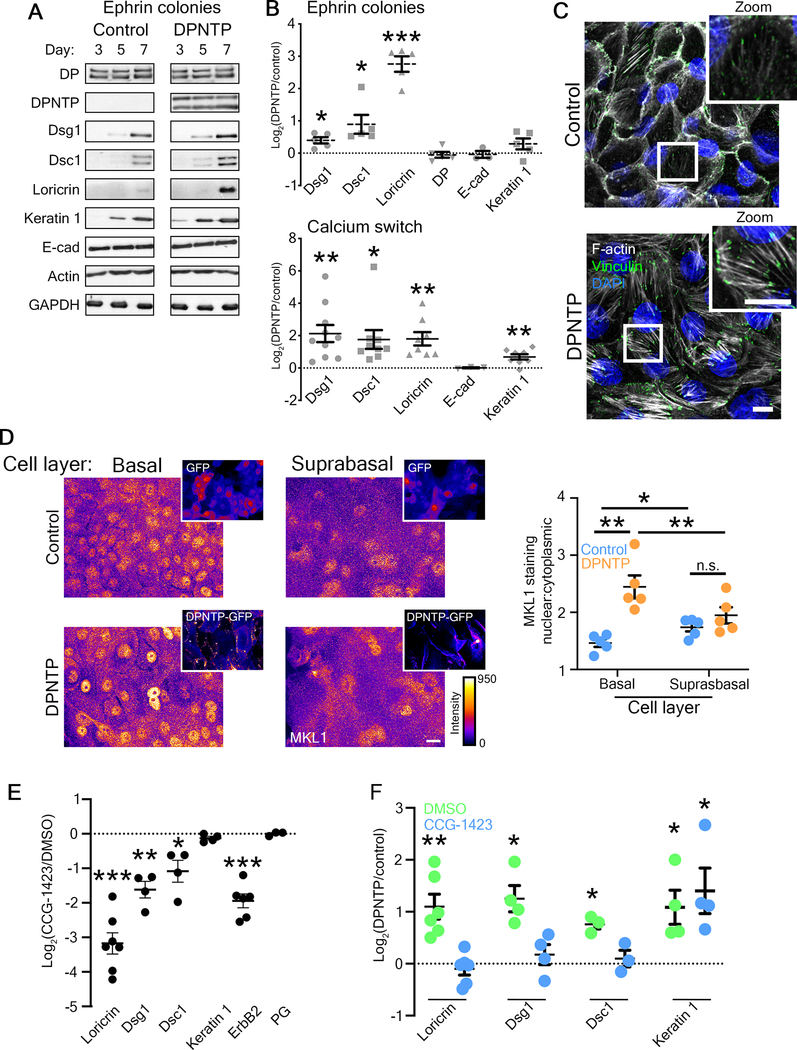
Figure 3. Uncoupling the desmosome/IF linkage promotes NHEK differentiation through the mechanosensitive SRF pathway.
A) Western blots showing the expression of the indicated proteins during a differentiation time course of control or DPNTP-GFP expressing ephrin colonies.
B) Upper, quantification of the fold change (Log2-transformed) of DPNTP-expressing over control ephrin colonies at day 7 is shown for expression of the indicated proteins. Means are from 3–5 independent experiments and error bars are SEM. *p≤0.04, ***p=0.0003, one sample t test with theoretical mean of 0. Lower, quantification of the fold change (Log2-transformed) of DPNTP-expressing over control monolayer cultures exposed to 1.2 mM calcium medium for 3–4 days are shown for indicated protein expression. Means are from 3–10 independent experiments and error bars are SEM. *p=0.016, **p≤0.004, one sample t test with theoretical mean of 0. See also Figure S4.
C) Maximum projection micrographs show F-actin (using phalloidin) and immunofluorescence staining of vinculin near the basal/substrate interface of differentiating monolayers of NHEKs expressing either GFP (Control) or DPNTP-GFP at 5 days after calcium switch. DAPI indicates nuclei in blue and bar is 10 μm.
D) Left, maximum projection micrographs show MKL1 immunofluorescence staining in the basal and suprabasal layers of day 5 cultures of NHEKs using the indicated lookup table. Bar is 10 μm. Insets show GFP and DPNTP-GFP expression. Right, quantification of the nuclear to cytoplasmic ratio of MKL1 staining is shown for cultures expressing GFP (Control) or DPNTP-GFP in the indicated cell layers. *p=0.021, **p≤0.009, paired t-test.
E) Quantification of the fold change (Log2-transformed) of cultures treated with the SRF inhibitor CCG-1423 over DMSO-treated controls at day 5 is shown for the indicated proteins. Means are from 3–7 independent experiments and error bars are SEM. *p=0.0423, **p=0.0065, ***p≤0.0002, one sample t test with theoretical mean of 0.
F) Quantification of the fold change (Log2-transformed) of DPNTP-expressing over GFP control keratinocytes is shown for the indicated protein expression for both DMSO and CCG-1423 treatment. Means are from 3–6 independent experiments and error bars are SEM. *p≤0.05, **p=0.006, one sample t test with theoretical mean of 0.
See also Figure S1.

