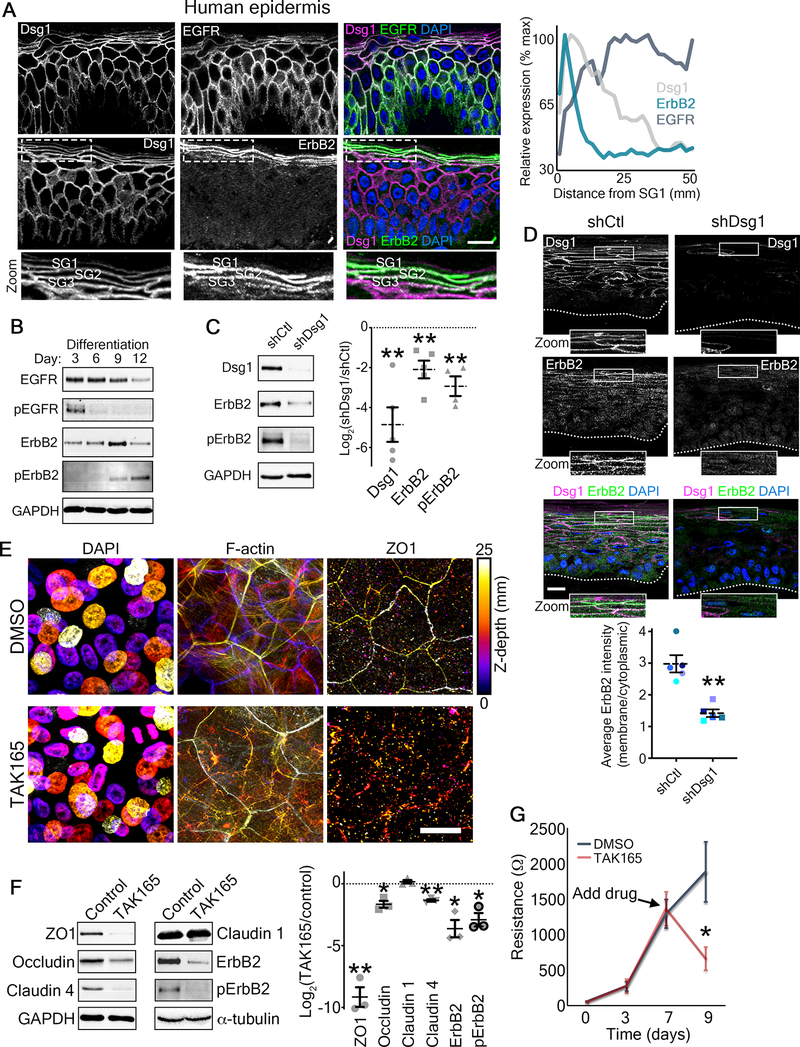
Figure 6. ErbB2 as a potential mediator of Dsg1-mediated effects on epidermal polarity and barrier function.
A) Left, representative micrographs of transverse sections of human epidermis immunostained for the indicated proteins are shown. Zoom is of area in dashed box highlighting the stratum granulosum (SG1–3). DAPI-stained nuclei are in blue and bar is 20 μm. Right, line scan analysis shows the average relative level of fluorescence intensity from 3 independent samples for the indicated proteins as a function of distance from the most superficial living epidermal layer (stratum granulosum, SG).
B) Representative western blots of a differentiation time course of human epidermal equivalent cultures showing the total EGFR and Y1068-phosphorylated EGFR (pEGFR) as well as total ErbB2 and Y877-phosphorylated ErbB2 (pErbB2). GAPDH is used as a loading control.
C) Left, representative western blots of day 6 human epidermal equivalent cultures expressing either a non-targeting shRNA (shCtl) or an shRNA targeting Dsg1 (shDsg1) showing Dsg1 protein level, total ErbB2, and Y877-phosphorylated ErbB2 (pErbB2). GAPDH is used as a loading control. Right, quantification of the fold change (Log2-transformed) of Dsg1-depleted over control cultures are shown for the indicated proteins. Dashed lines indicate the mean of at least 4 independent experiments and error bars are SEM. **p<0.01, one sample t test with theoretical mean of 0.
D) Micrographs of transverse sections of day 6 human epidermal equivalent cultures expressing either a non-targeting shRNA (shCtl) or an shRNA targeting Dsg1 (shDsg1) immunostained for Dsg1 and ErbB2 are shown. Dotted line marks the bottom of the basal layer. DAPI-stained nuclei are in blue and bar is 20 μm. Lower, quantification of ErbB2 immunofluorescence intensity expressed as a ratio of the membrane localized signal over the cytoplasmic localized signal. Dashed lines indicate the mean of 5 independent experiments and error bars are SEM. **p=0.008, paired t test.
E) Day 9 transwell epidermal equivalent cultures were treated with either DMSO or the ErbB2 inhibitor TAK165 (1 μM) for the last 48 hours prior to harvesting. Maximum projection micrographs show staining for nuclei (DAPI), F-actin (phalloidin), and immunostaining for the tight junction protein ZO1 using a look-up table that indicates z-depth. Bar is 25 μm. See also Figure S7.
F) Day 9 transwell epidermal equivalent cultures were treated with either DMSO or the ErbB2 inhibitor TAK165 (1 μM) for the last 48 hours prior to harvesting. Left, western blots showing the expression of the indicated tight junction proteins for samples treated with either DMSO (Control) or TAK165. GAPDH and α-tubulin are used as loading controls. Right, quantification of the fold change (Log2-transformed) of TAK165-treated over control cultures are shown for the indicated proteins. Dashed lines indicate the mean of 3 independent experiments and error bars are SEM. *p=0.025, **p<0.01, one sample t test with theoretical mean of 0.
G) Quantification of resistance measurements from TEER experiments performed on a time course of transwell epidermal equivalent cultures that were treated with either DMSO or the ErbB2 inhibitor TAK165 (1 μM) on day 7 (as indicated) for the last 48 hours. *p=0.0325, paired t test from 5 independent experiments. Data are presented as mean ± SEM.
See also Figure S1.

