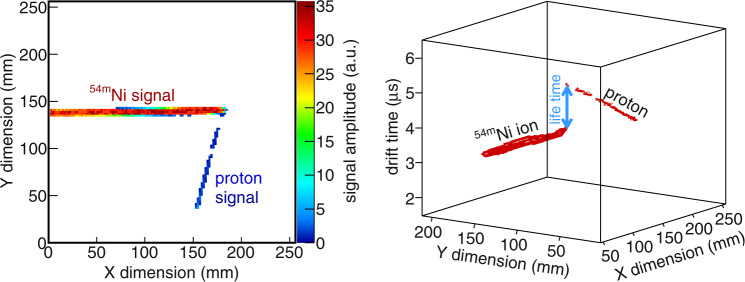
Fig. 2. Example of a 54mNi implantation followed by its proton radioactivity.
The left plot shows the amplitude of the ionization signal measured on the (X,Y) pads of the collection plane of ACTAR TPC: the proton track can be distinguished from the ion track. In the right plot, the signal is presented in the 3D space, where the vertical coordinate is the drift time of the signal: it can be converted to the Z dimension by means of the drift velocity of the signal. The vertical gap between the two tracks is due to the decay time of the isomer: the proton is emitted while the ionization electrons created by the ion have already started to drift.

