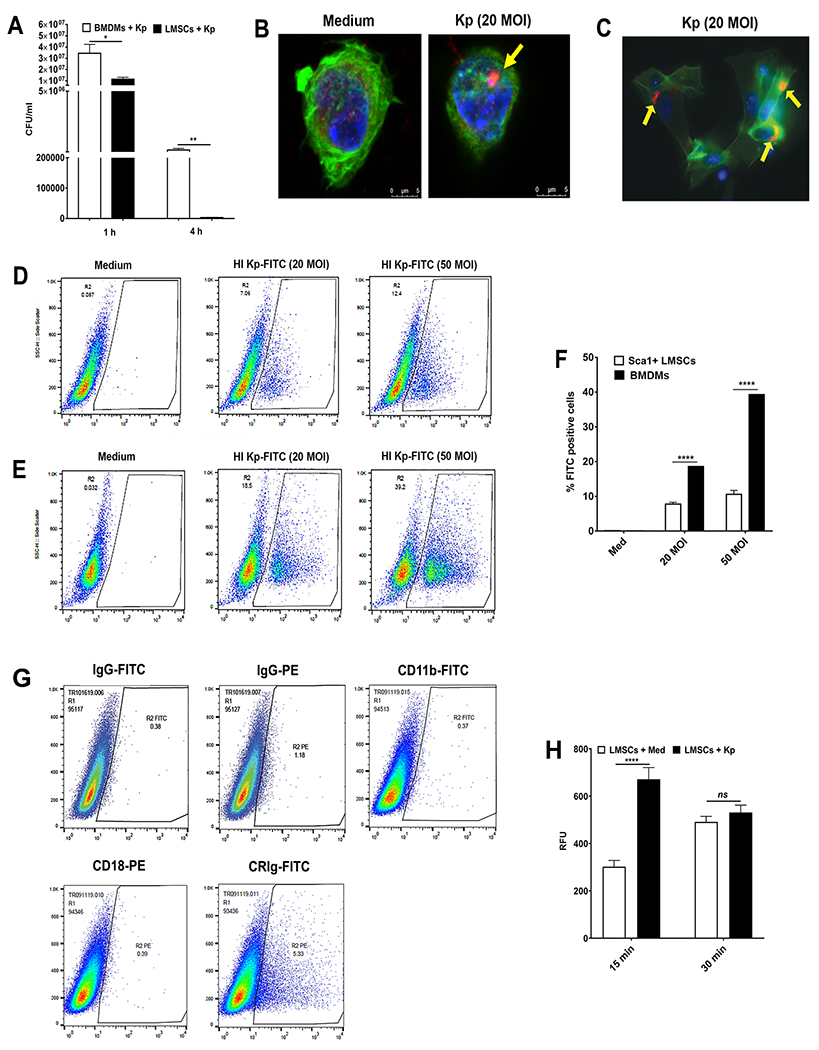
FIGURE 4. Phagocytotic uptake and intracellular killing of K. pneumoniae by Sca1+ LMSCs and BMDMs.

(A) Bacterial uptake and intracellular killing abilities of Sca-1+ LMSCs and BMDNs was assessed at 1 h and 4 h by measuring intracellular live bacteria in these cells, as described in the Methods section. Data are expressed as the mean ± SEM from three independent experiments. *, p < 0.05; **, p < 0.01 as compared with LMSCs by multiple t tests. (B) Fluorescence confocal microscopy of Sca-1+ LMSCs cultured with medium (B, left panel) or cultured with 20 MOI of opsonized K. pneumoniae (B, right panel) for 3 h. K. pneumoniae (red) and F-actin (green) were stained as described in the Methods section. A representative confocal section through the middle of Sca-1+ LMSCs is shown for observation of intracellular K. pneumoniae (B, indicated by yellow arrow in right panel). Magnification x60. (C) A representative immunofluorescence microscopy image shows the presence of K. pneumoniae (C, indicated by yellow arrows) in infected Sca-1+ LMSCs. Magnification x40. (D-F) Examination of phagocytic capacity of BMDMs and Sca-1+ LMSCs by flow cytometry. Representative dot plots of Sca-1+ LMSCs (D) and BMDMs (E) cultured separately either with medium or with 20 or 50 MOI of opsonized HI Kp-FITC. (F) The percentage Sca1+ LMSCs and BMDMs positive for HI Kp-FITC are shown as a bar graph. The results are mean ± SEM from two independent experiments (3-4 samples in each group). ****, p < 0.0001 by multiple t-tests. (G) Analysis of expression of CR3 (CD11b/CD18) and CRIg in Sca-1+ LMSCs using flow cytometer. Representative dot plots of Sca-1+ LMSCs stained separately with isotype control antibodies or fluorescence conjugated CR3 (CD11b-FITC/CD18-PE) and anti-CRIg (CRIg-FITC) antibodies are shown. n = 2 independent experiments. (H) Sca-1+ LMSCs produce intracellular ROS upon infection with K. pneumoniae. Data are mean ± SEM from three independent experiments (triplicate samples). ****, p < 0.0001 by multiple t tests.
