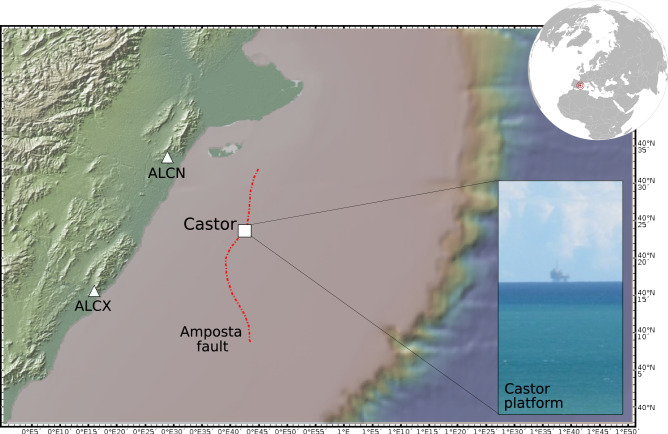
Fig. 1. Overview map of the study region offshore Spain.
The map shows the location of the Castor platform (white square), closest seismic stations ALCN and ALCX (white triangles), and the approximate trace of the Amposta fault (red dotted lines)47,48. The upper right inset shows the geographical location of the study area, the lower right inset a photo of the Castor platform (courtesy Álvaro González). The map has been plotted with GeoMapApp (www.geomapapp.org), using the Global Multi-Resolution Topography (GMRT)70 and regional bathymetry after the EMODNET 500 m compilation.

