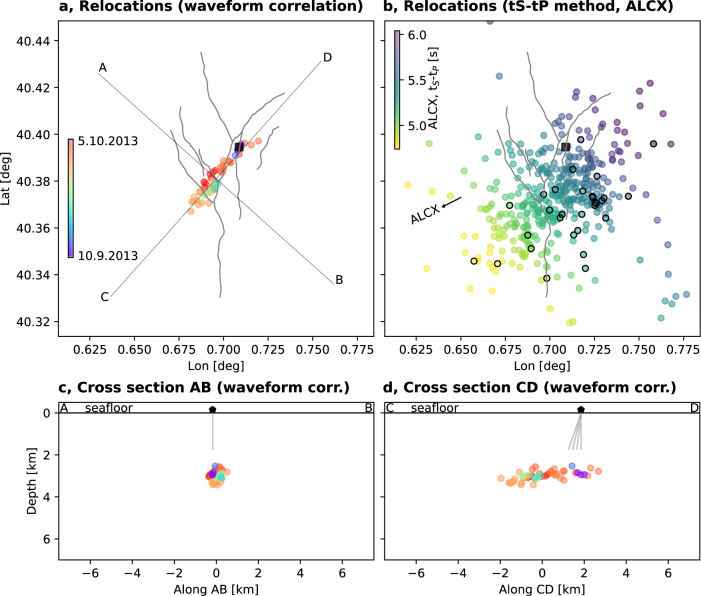
Fig. 2. Locations based on waveform correlations and tS-tP method.
a, c, d Locations based on waveform correlations in map view and cross-section. b Locations based on tS-tP method in cross-section. Earthquake locations (circle, colors denoting origin time in a, c, d, and S-P differential time at station ALCX in b, according to color bars in a and b, respectively) are plotted in map view (a, b) and along AB (c) and CD (d) cross-sections (profiles AB and CD are shown in a). Black circles in b denote those events used in the waveform correlation location (a), for which S-P time estimates are available. A pentagon denotes the location of the Castor platform, double gray solid lines sketch the injection wells29.

