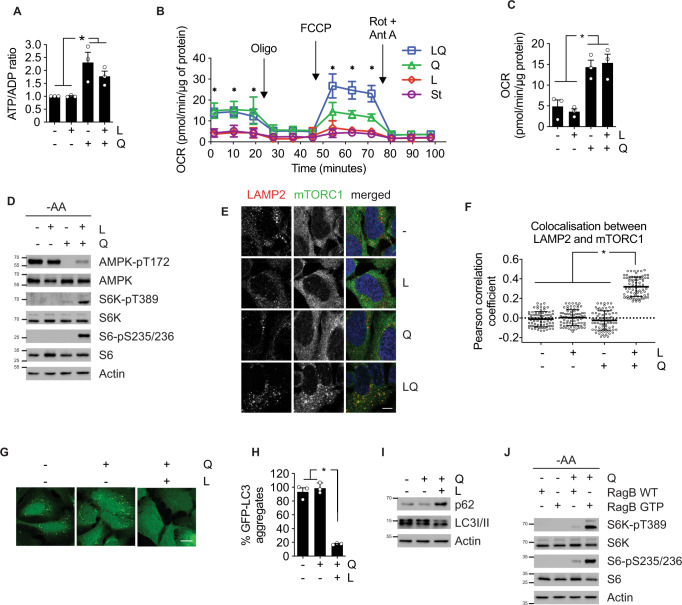
Fig. 4. Glutamine metabolism activates mTORC1 following two parallel, necessary branches.
A ATP/ADP ratio of amino acid-starved U2OS cells incubated with leucine and/or glutamine during 72 h. B OCR analysis by Seahorse® technology of amino acid-starved (purple) U2OS cells incubated with leucine (red) and/or glutamine (Q green, LQ blue) during 72 h. OCR was measured either in basal conditions or after the injection of oligomycin, FCCP, and rotenone/antimycin A. Data are mean ± SEM of three biologically independent experiments performed with five replicates. C Basal respiration used to drive ATP production as determined by OCR quantification of data obtained in (B). D Immunoblot of mTORC1 activity markers (S6K and S6 phosphorylation) and AMPK phosphorylation of amino acid-starved U2OS cells incubated with leucine and/or glutamine during 72 h. E Immunofluorescence microscopy captions of U2OS cells incubated with leucine and/or glutamine during 72 h. Cells were stained against LAMP2 (lysosomal marker, red), mTORC1 (green) and DAPI (blue). Scale bar represents 10 µm. F Quantification of the colocalization between LAMP2 and mTORC1 as shown in (E). Person’s R value was evaluated using ImageJ coloc2 plugin on 25 ROI in three biologically independent experiments (75 ROI in total per condition). G Fluorescence microscopy captions of GFP-LC3 expressing amino acid-starved U2OS cells incubated in the presence of glutamine and/or leucine during 72 h. Autophagosome formation upon GFP-LC3 aggregation was assayed using confocal microscopy. The scale bar represents 10 µm. H Quantification of the number of GFP-LC3 dots per cell of captions obtained in (G). >100 cells were counted per experiment. I Immunoblot of autophagy (p62 and LC3-I/II) markers of amino acid-starved U2OS cells incubated in the presence of glutamine and/or leucine during 72 h. J U2OS cells were transfected with RagB WT plasmid or RagB 54 L plasmid. Amino acid-starved cells were then incubated with or without glutamine for 72 h. Downstream targets of mTORC1 (S6K and S6 phosphorylation) were assessed by immunoblot. Graphs show mean values ± SEM (n = 3 biologically independent experiments). *p < 0.05 (ANOVA analysis followed by a post hoc Bonferroni test). Source data are provided as a Source Data file.

