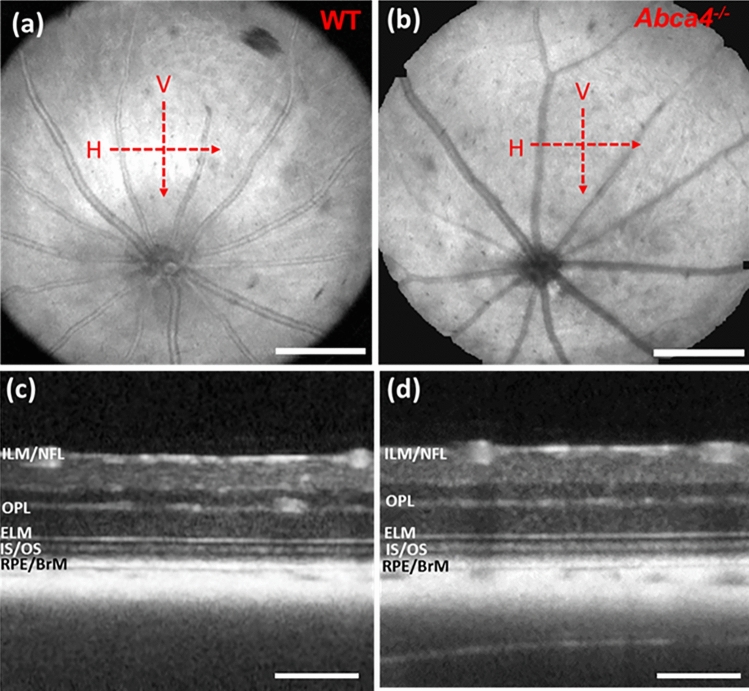
Figure 1.
Representative en face OCT fundus and B-scan images. (a) En face fundus image of a WT mouse. (b) En face fundus image of an Abca4−/− mouse. Red dashed arrows show the location and direction of OCT scanning in horizontal (H) and vertical (V) directions. (c) Averaged B-scan acquired (zero-degree incident angle) from a WT mouse along the H direction. (d) Averaged B-scan acquired (zero-degree incident angle) from an Abca4−/− mouse along the H direction. Scale bar (a,b): 400 μm; scale bar (c,d): 200 μm.

