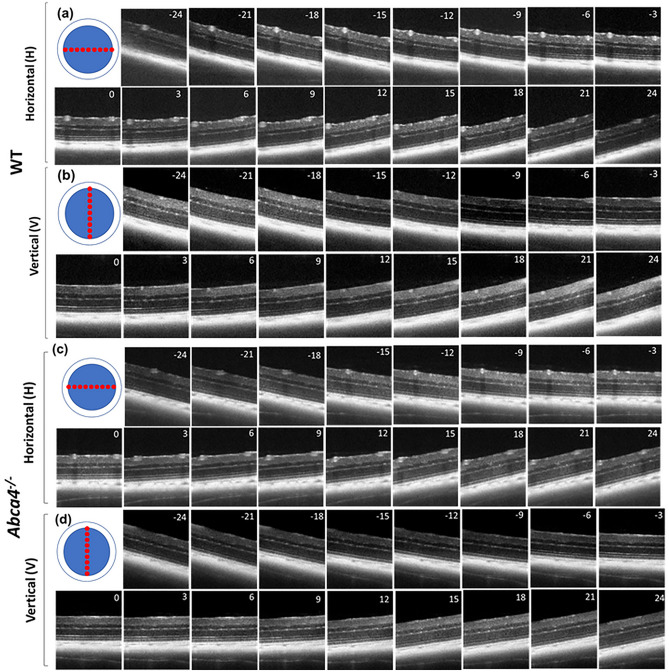
Figure 2.
Averaged representative directional OCT B-scans (log scale) acquired from a WT and an Abca4−/− mouse. (a) B-scans from a WT mouse corresponding to 17 beam entry positions along the H direction. (b) B-scans from a WT mouse corresponding to 17 beam entry positions along the V direction. (c) B-scans from an Abca4−/− mouse corresponding to 17 beam entry positions along the H direction. (d) B-scans from an Abca4−/− mouse corresponding to 17 beam entry positions along the V direction. The number provided in each B-scan represents the incidence angle of retinal illumination.

