Figure 5.
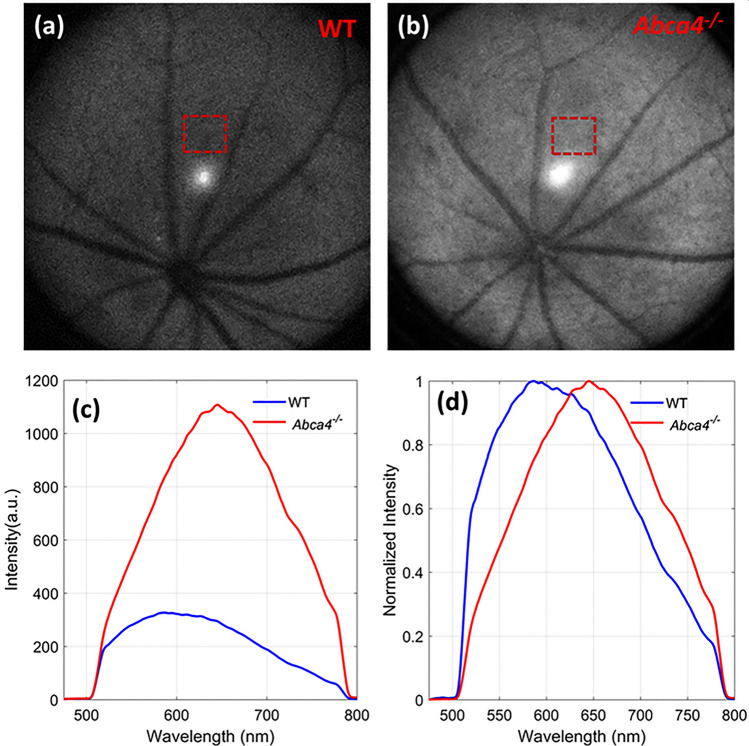
In vivo FAF images and emission spectra acquired with 488 nm excitation. Representative FAF images from (a) a WT and (b) an Abca4−/− mouse. (c) Absolute emission spectra measured from a WT control and an Abca4−/− mouse. (d) Normalized emission spectra from (c). Dashed red rectangles in (a,b) show the locations where AF spectra were measured. The sharp decline in fluorescence in (c,d) at about 510 nm and 780 nm are due to dichroic cutoff filter.

