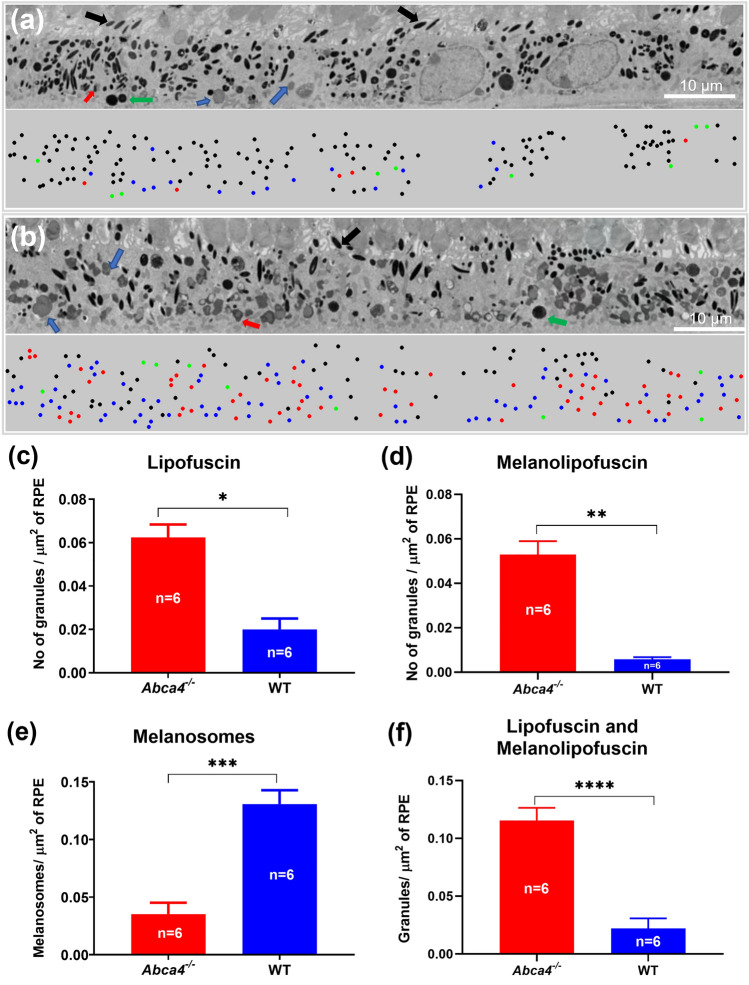
Figure 8.
Representative EM images showing cross sections of the RPE cell layer and RPE granules. (a) The RPE cell layer of a WT mouse. (b) The RPE cell layer of an Abca4−/− mouse. The bottom panels of (a,b) are the color-coded classified granules showing their locations. Number of granules per μm2 calculated for (c) lipofuscin, (d) melanolipofuscin, (e) melnaosomes, and (f) combined lipofuscin and melanolipofuscin. The values shown are means and standard error. Six images were quantified per strain (one eye each from 2 animals per group were analyzed and 3 images per eye were counted). Black arrows and dots: melanosomes; Blue arrows and dots: lipofuscin; Green arrows and dots: phagocytosed outer segments; red arrows and dots: melanolipofuscin, Scale bars: 10 μm. (*p < 0.001, **p < 0.01, ***p < 0.001, ***p < 0.001).

