
Figure 2. Validation of the continuum of erythroid progenitors.
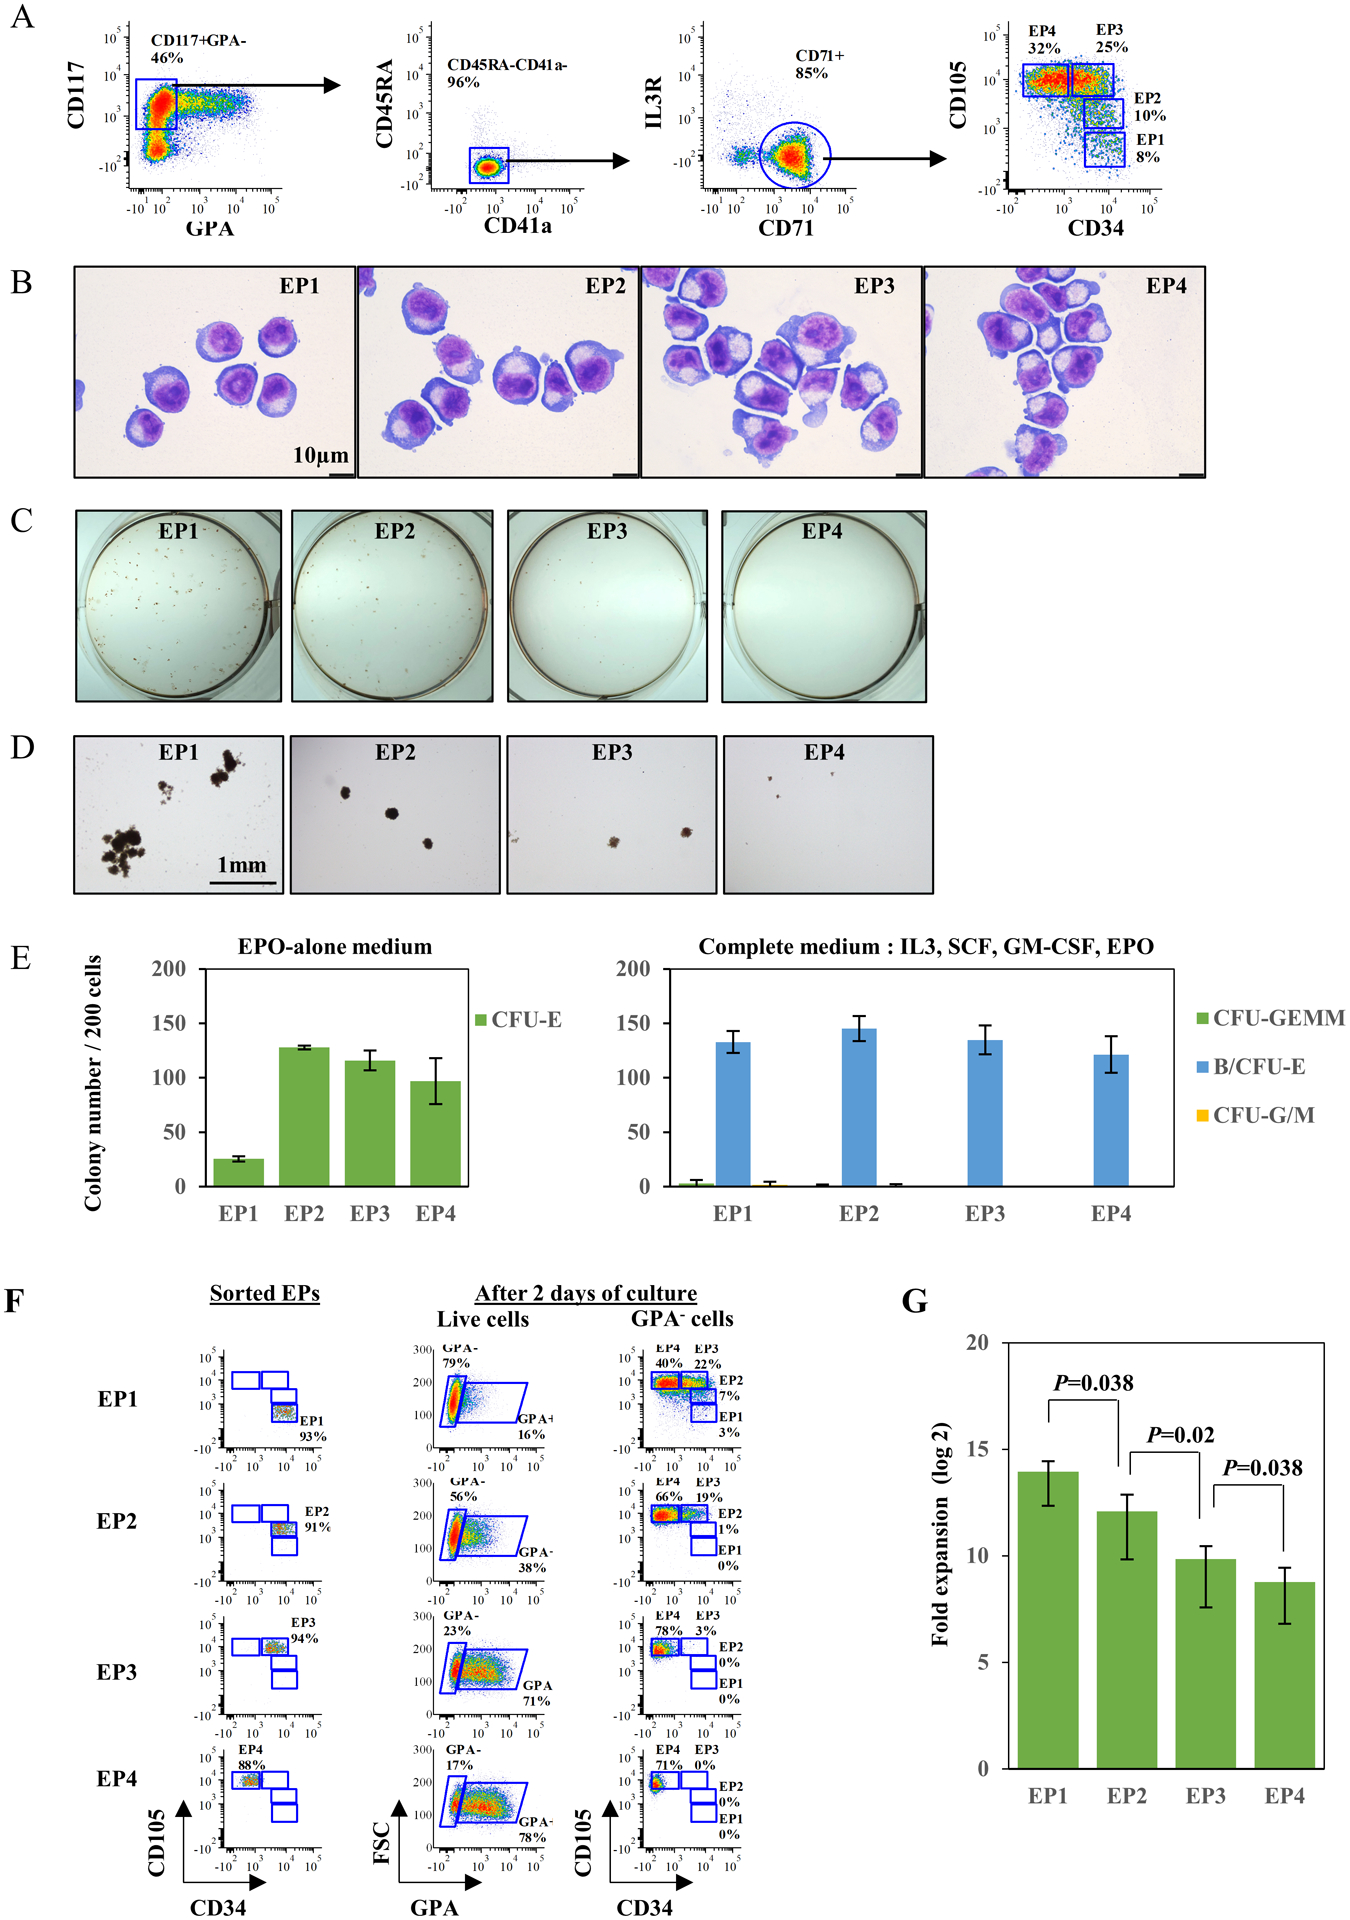
(A) Representative FACS plots for definition of erythroid progenitors from in vitro culture of human CD34+ cells, on day 5 of differentiation. (B) Representative cytospin images of sorted IL3R+CD71−, EP1, EP2, EP3 and EP4 cells from in vitro culture of human CD34+ cells. The cells were sorted on day 5 of differentiation. The images were captured under Leica DM2000 microscope at ×100 magnification, scale bar=10μm. (C) Representative images of colonies generated by sorted IL3R+CD71−, EP1, EP2, EP3 and EP4 cells from in vitro culture of human CD34+ cells, in complete medium. The photos were taken using a Nikon D3500 camera. (D) Representative images of colonies generated by sorted IL3R+CD71−, EP1, EP2, EP3 and EP4 cells from in vitro culture of human CD34+ cells, in complete medium. The photos were taken under an inverted microscope at ×4 magnification, scale bar=1mm. (E) Quantitative analysis of colony forming ability of sorted IL3R+CD71−, EP1, EP2, EP3 and EP4 cells from in vitro culture of human CD34+ cells. The data are from three independent experiments. (F) Representative FACS plots for sorting purity of EP1, EP2, EP3 and EP4 (left panel) and their differentiation progress after two days of culture (right panel). (G) Number of cell divisions of EP1 to EP4 by the end of differentiation. The numbers were calculated based on final erythroid yield of EP1 to EP4 under same culture conditions. The data are from three independent experiments.