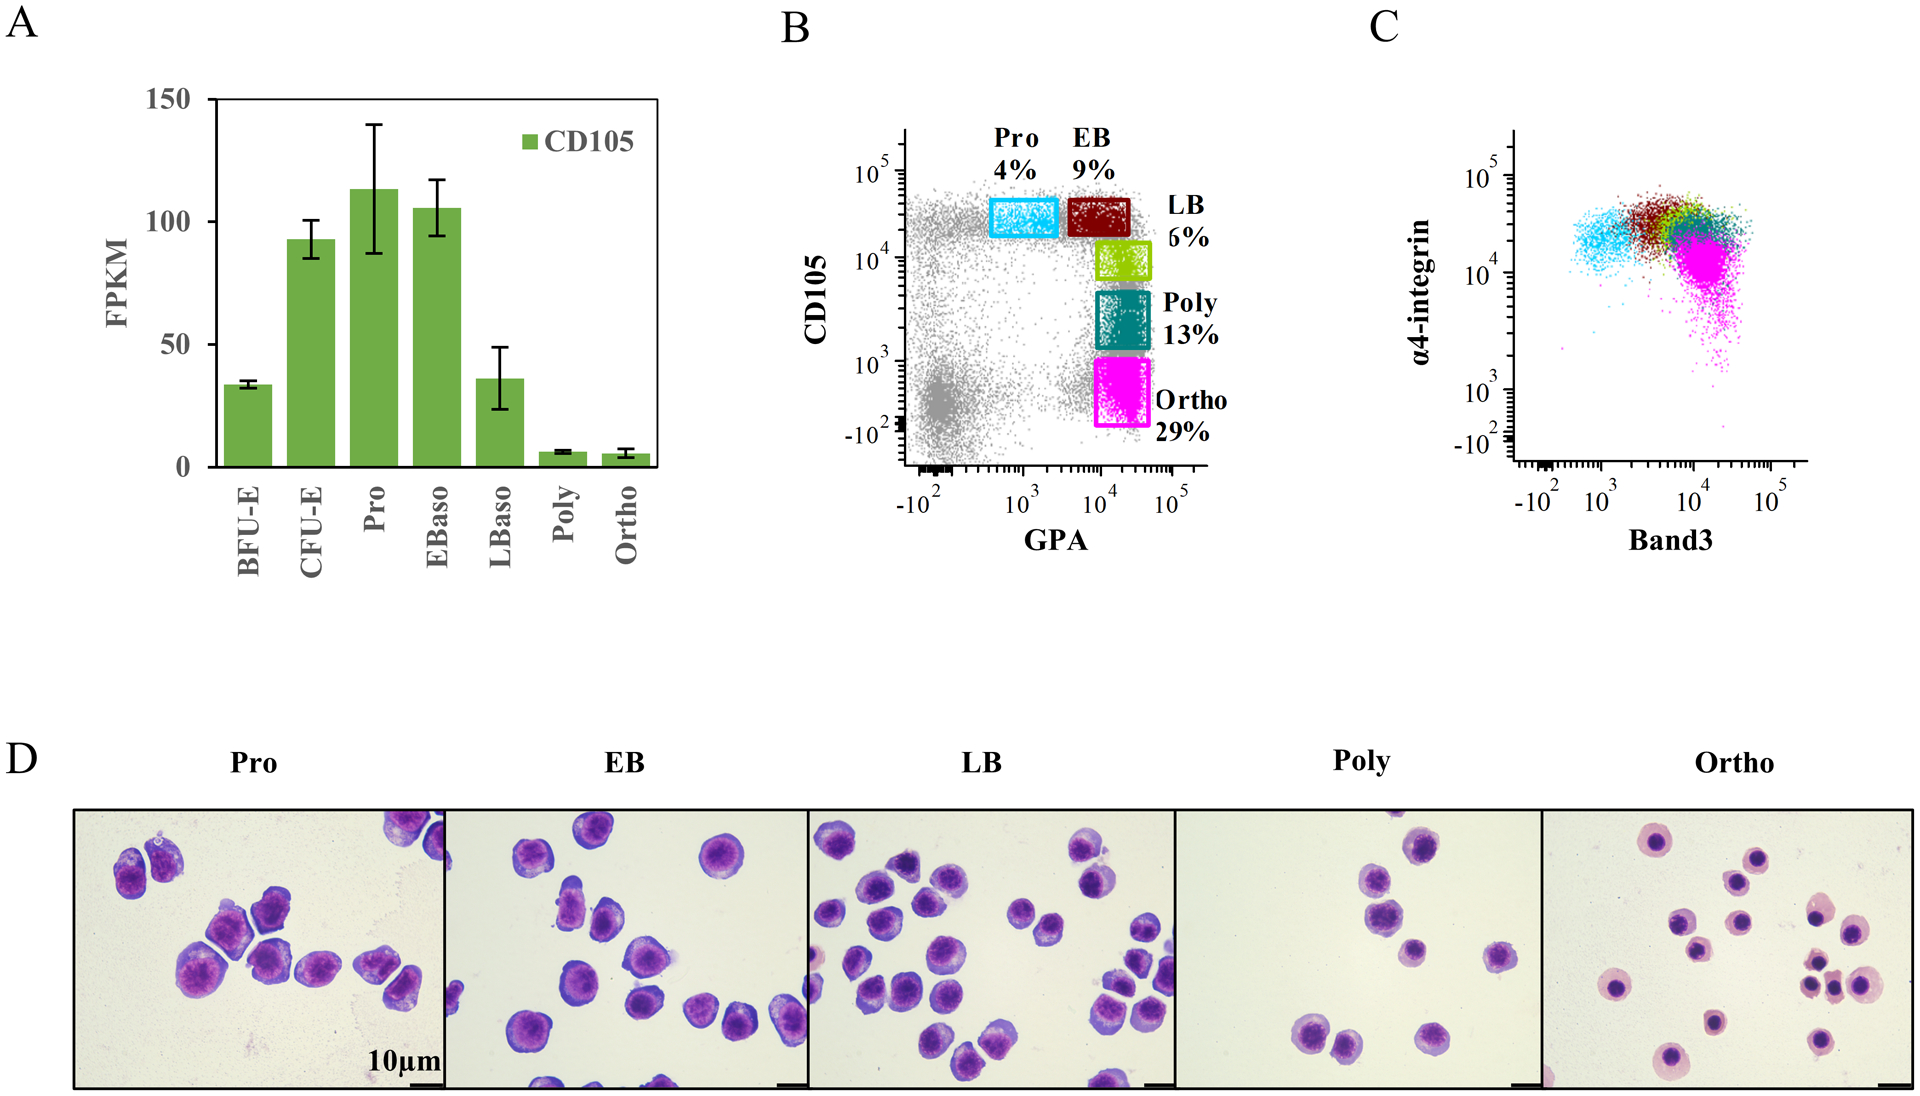
Figure 4. Decreases in CD105 expression levels distinguish terminally differentiating erythroblasts in human bone marrow.

(A) Relative mRNA expression of CD105 at distinct stages of erythroid differentiation. The data are from RNA-seq on 3 biological replicates. (B) Representative FACS plots for definition of erythroblasts at distinct stages. The gates were made based on expression of CD105 and GPA. (C) Dot plot overlay of gated erythroblast populations showing their expression of α4-integrin and Band3. The color of each population sources from the gating plot (B). (D) Representative cytospin images of sorted erythroblasts at distinct stages from primary bone marrow. The images were captured under Leica DM2000 microscope at ×100 magnification, scale bar=10μm.
