
Figure 6. The impaired terminal erythroid differentiation in MDS is associated with defective erythroid progenitor differentiation.
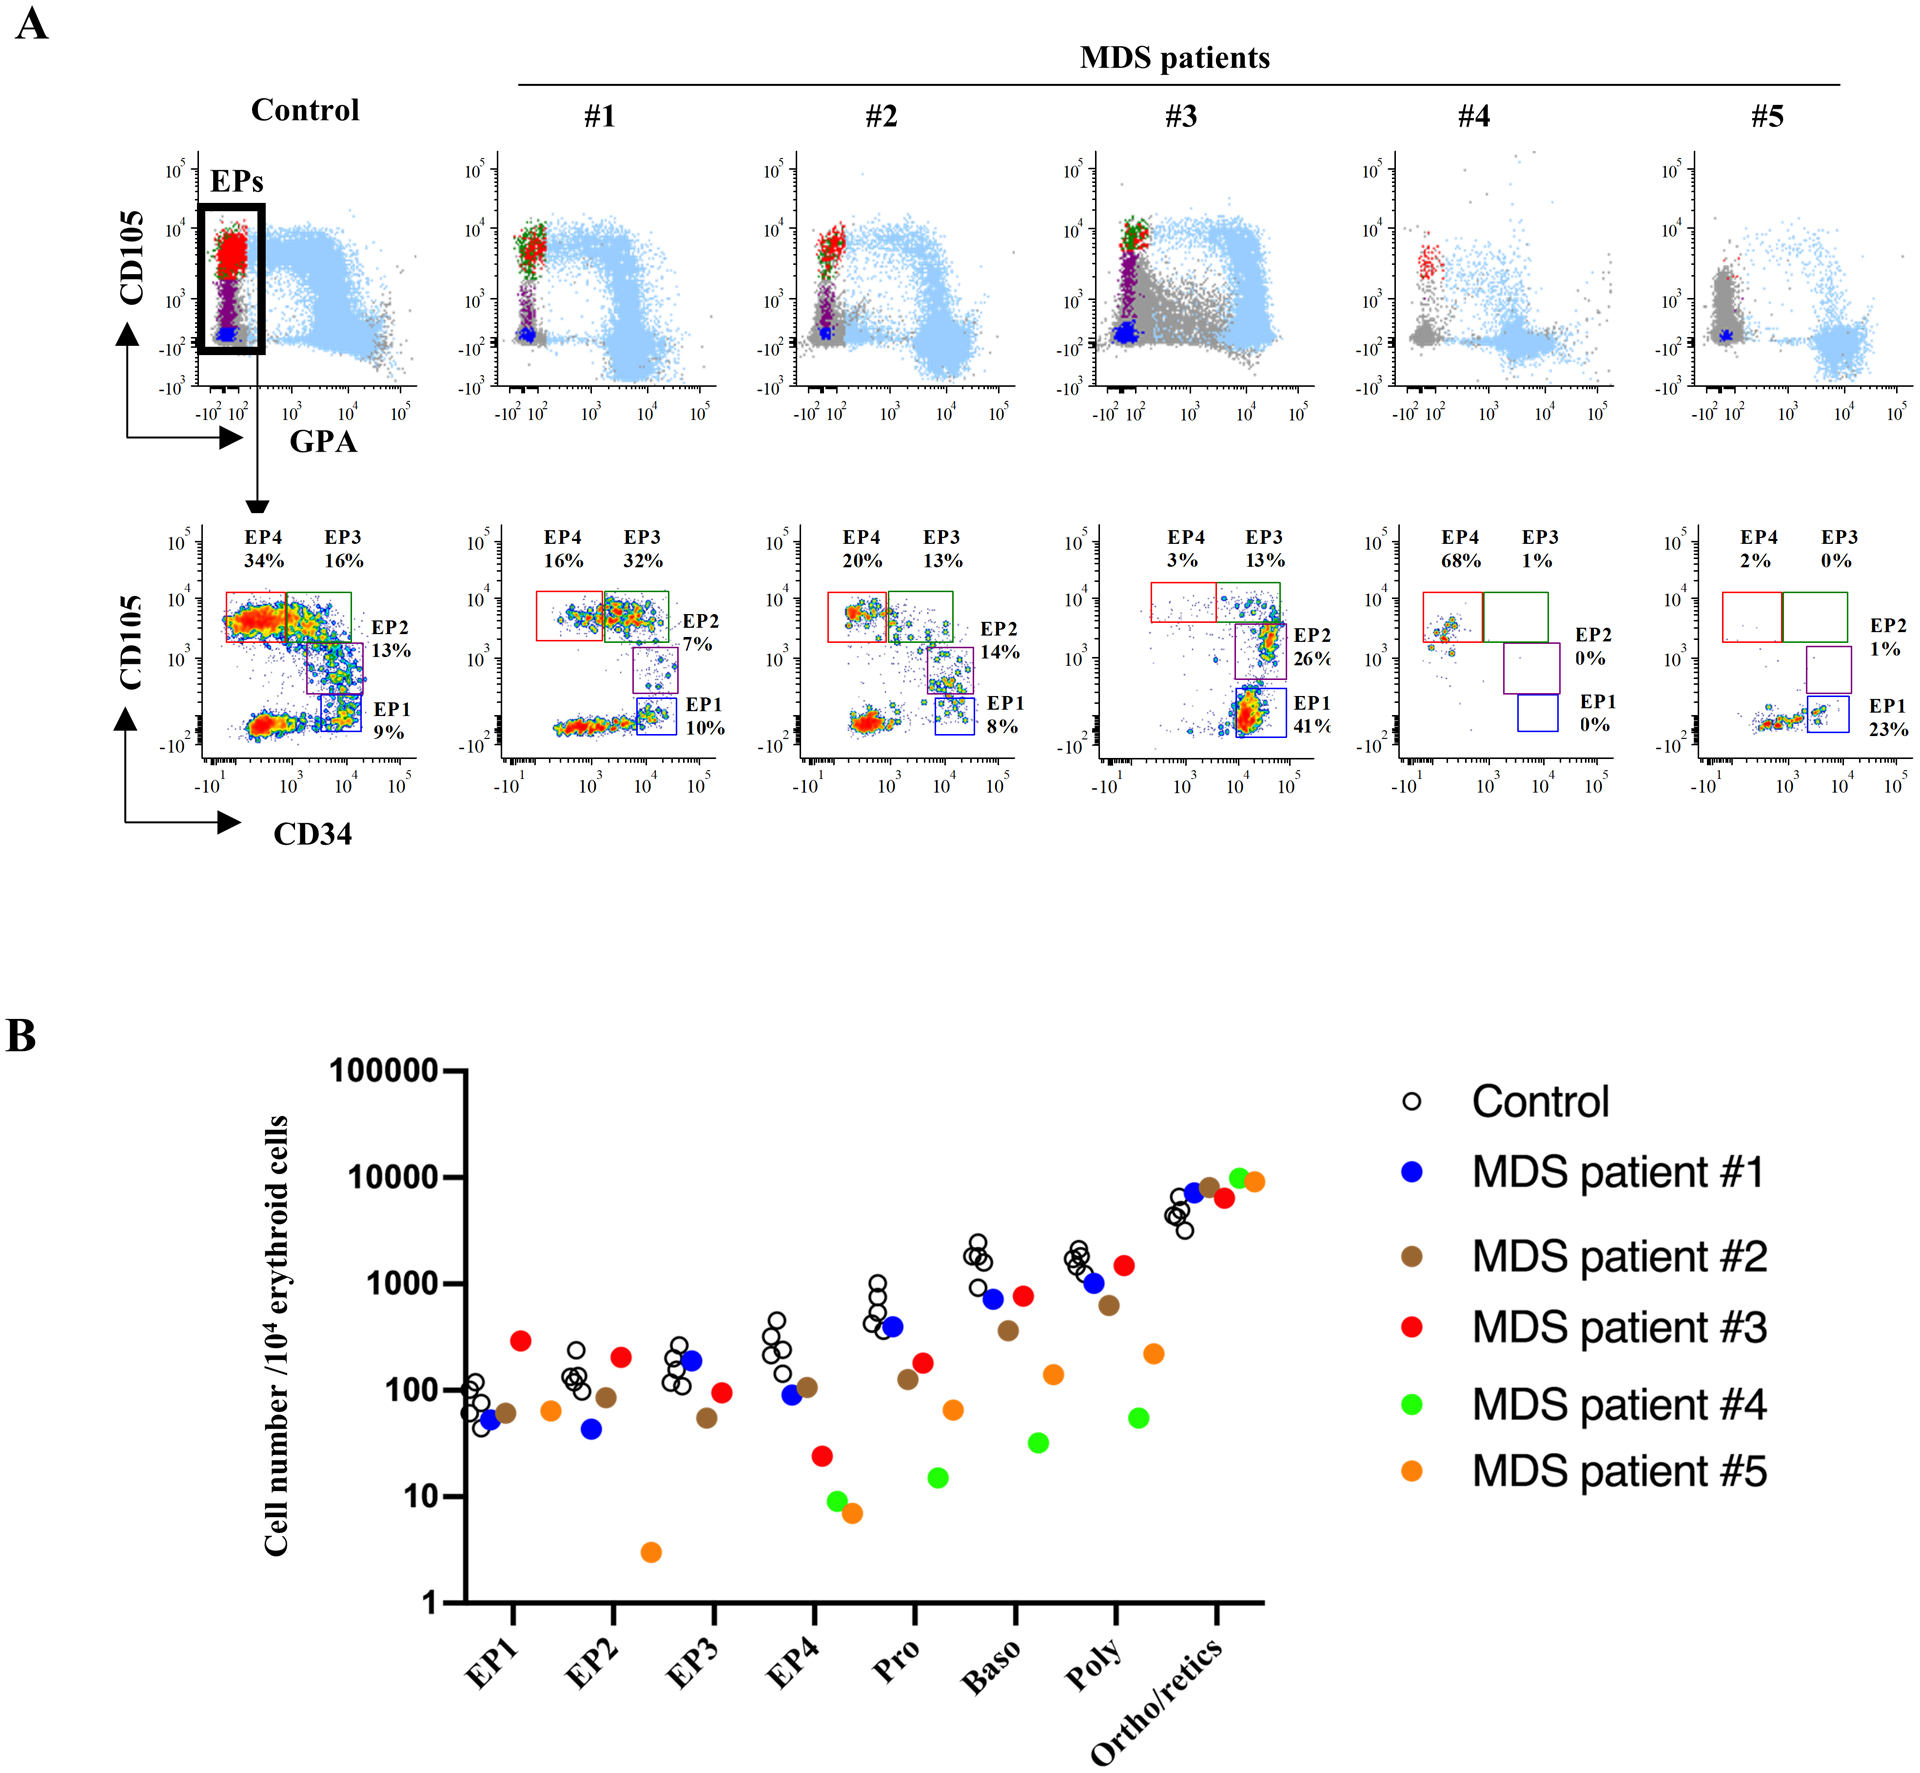
(A) The FACS plots showing erythroid continuum in MDS. The upper panel shows CD105/GPA overlay of erythroid populations, and the lower panel shows further analysis on erythroid progenitor differentiation. (B) Quantification of erythroid progenitors and erythroblasts showing decreased EPs in MDS patients with impaired terminal erythroid differentiation. The Y-axis indicates the cell number of each population in 104 erythroid cells. The black circles are healthy controls and the colored dots represent the different MDS samples. Each color corresponds to a specific MDS sample.